Creating a Soundscape Job
What is a Soundscape?
Soundscapes are a subject of acoustic ecology that allows you to visualize all the acoustic frequencies that emanate from the environment (e.g. animal calls, environmental factors, human activity). Soundscapes can be visually displayed by aggregating sounds in different temporal and spatial scales (e.g. time of day, season, altitude).
Soundscapes allow a user to visualize all the frequencies that are dominant during certain times of the day or season, providing a framework to describe, compare and analyze acoustic information from many sites and many animal taxa simultaneously.
How to Run a Soundscape Analysis
1. In the project menu, click Audio analyses then Soundscape Analysis.

Click on New Job.

2. A pop-up will appear where you will give the job a name, select a playlist for the job to be run over, and select the job parameters.
Note: The job type to use for the majority of use cases is single-soundscape. The multi-soundscape features allows you to run soundscape scapes across multiple sites at once using the same parameters. We strongly recommend only using the multi-soundscape option AFTER you have experimented with the single-soundscape jobs to understand how it works and what parameters to use for your project.
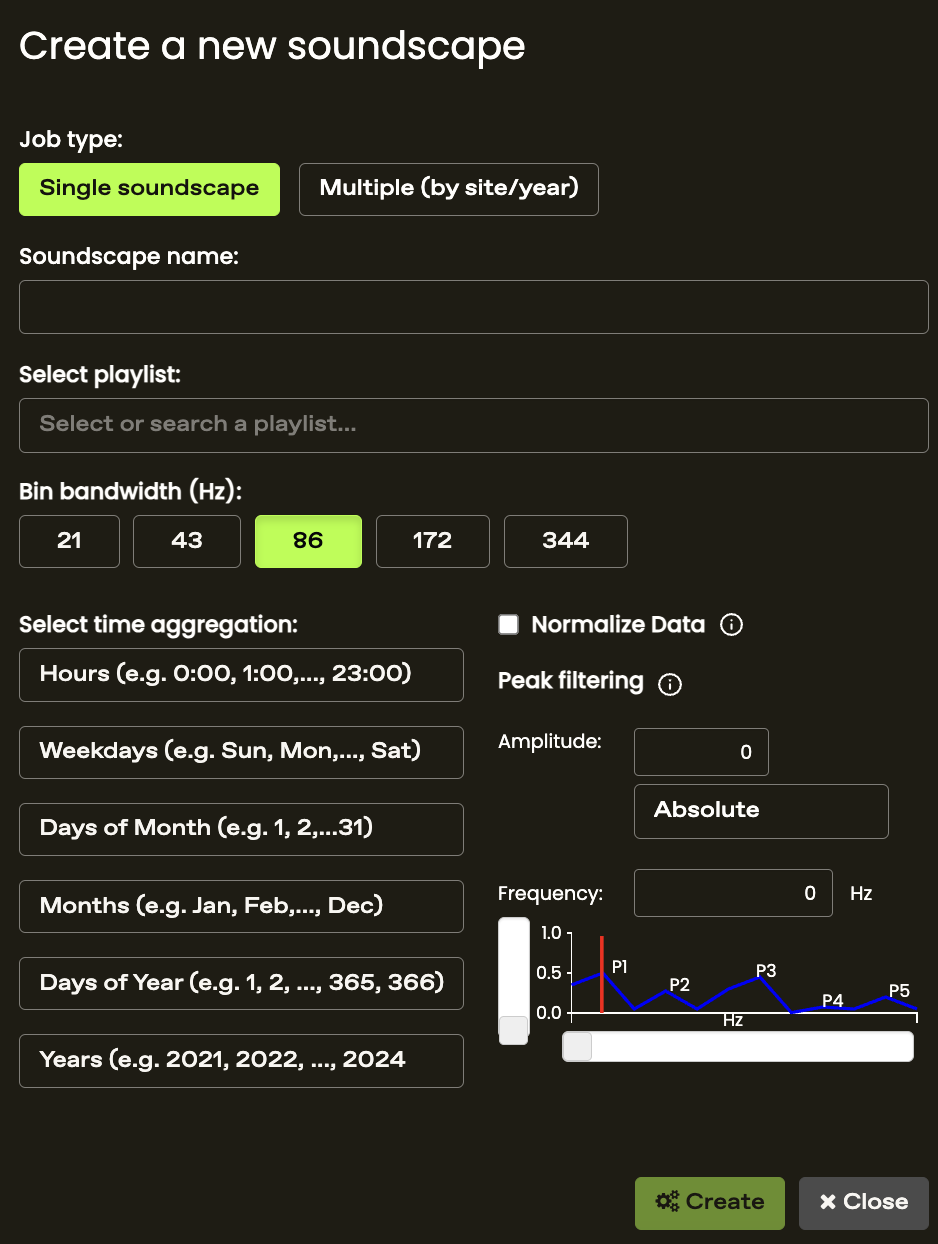
Soundscape Parameters
- Time Aggregation: how you want the soundscape to be grouped temporally (time of the day, days of the week, months, years, etc.)
- Our recommendation is to use time-of-day
- Normalize Data: checking this box will ensure that the data is normalized by dividing the number of recordings with a peak in a frequency bin by the total number of recordings collected during each time interval.
- Our recommendation is to check this box
- Bin Bandwidth (Hz): explore different bin sizes, maintaining the values of the other parameters and compare the obtained results.
- Our recommendation is to use 344Hz
- Amplitude Threshold: the amplitude level for a sound (within each bin) to be considered in the soundscape analysis. For example, setting an amplitude threshold of 0.1 means that all sounds with an amplitude above 0.1 will be included in the measure of acoustic space use (whether a bin is ‘used’ i.e., there is acoustic activity within it)
- Our recommendation is to use 0.05
- Amplitude Type: whether to use the Absolute amplitude (raw amplitude value assigned to each peak) or Relative amplitude to maximum (proportion of the maximum amplitude of the largest peak within the recordings used to create the soundscape).
- Our recommendation: If the recordings were collected using the same recorder model, then use ‘Absolute.’ If the recordings were collected with different recorders/models, use ‘Relative.’
- Frequency: allows you to select the frequency threshold which determines the minimal distance between two peaks of sounds to be included in the soundscape.
- Our recommendation is to leave this value at 0 because the selection of the bin bandwidth already deals with the frequency variation.
3. When you are finished selecting the soundscape parameters, Click Create.
You will be able to check the status of your job by going to the project menu and clicking Audio analyses, then Active jobs.


5. Once the job is complete, it will show up in your list of Soundscape Results.

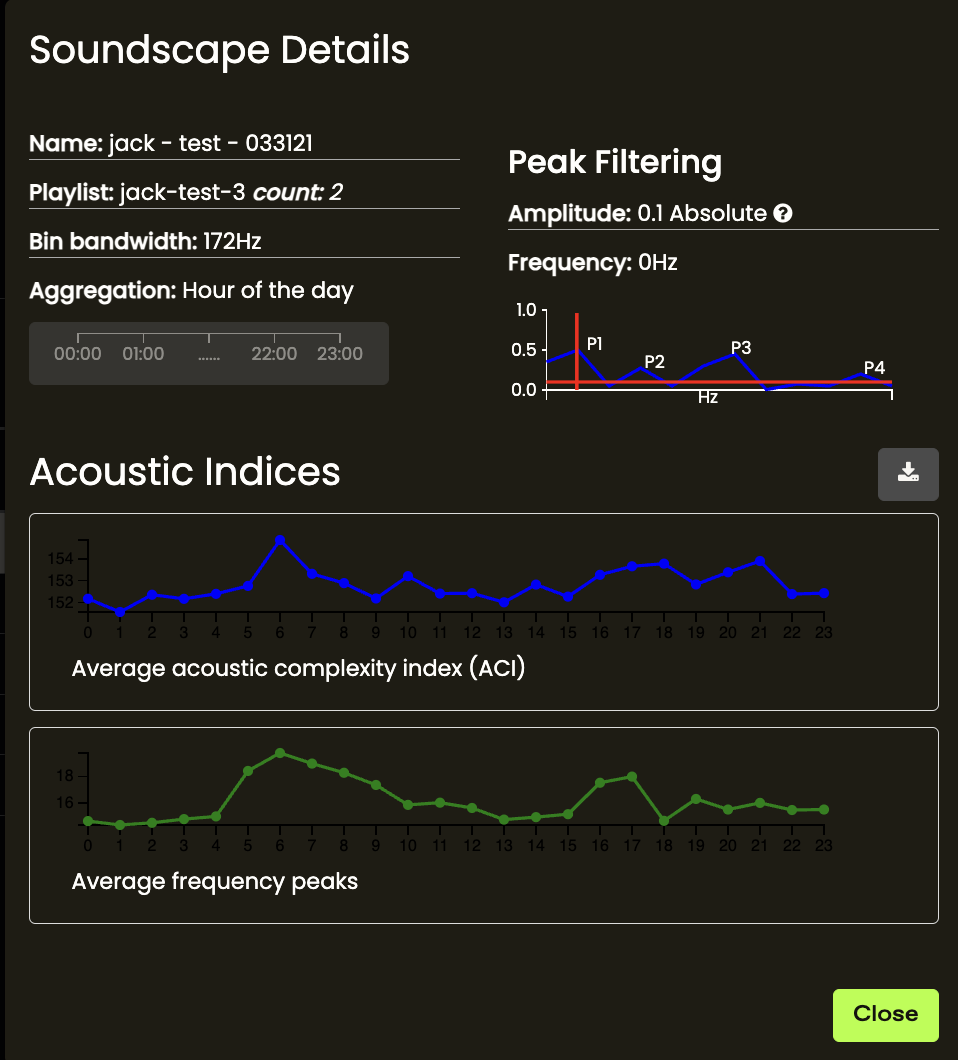
4. To view the inputs of the job, click Show Details. This will show the parameters used to run the job and two acoustic indices (Acoustic Complexity Index and Average Frequency Peaks)
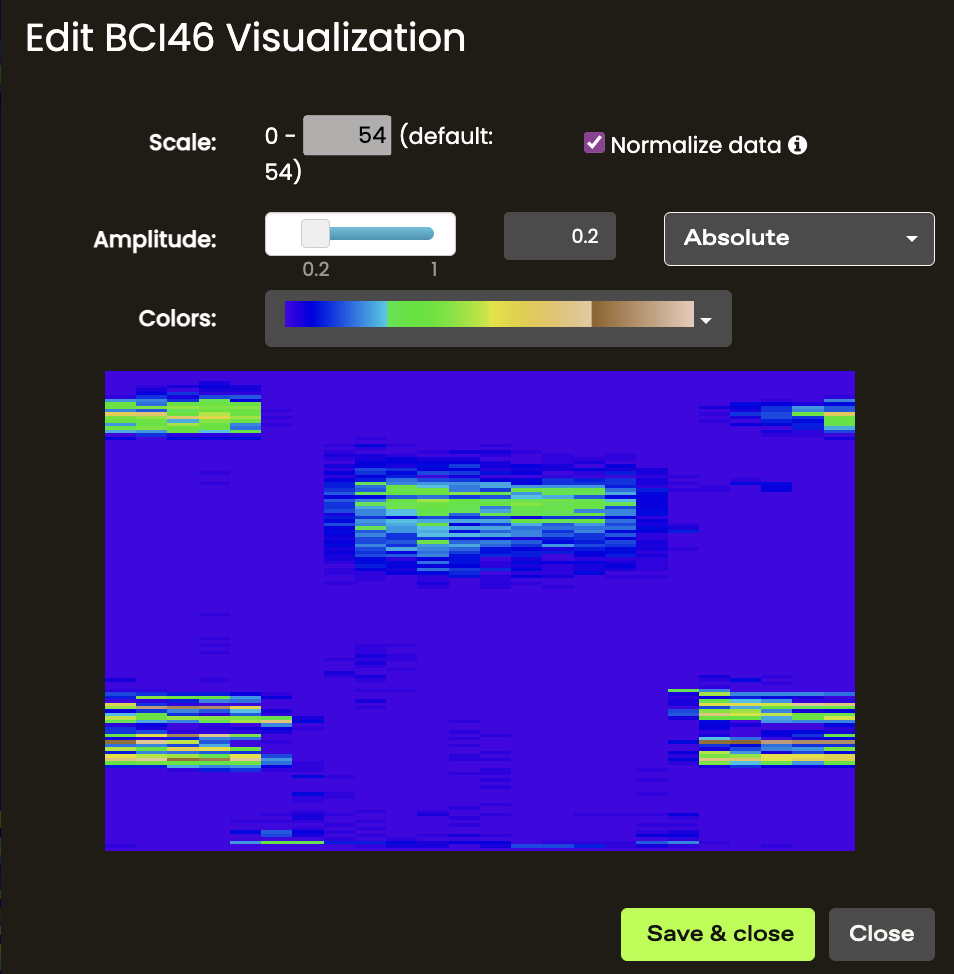
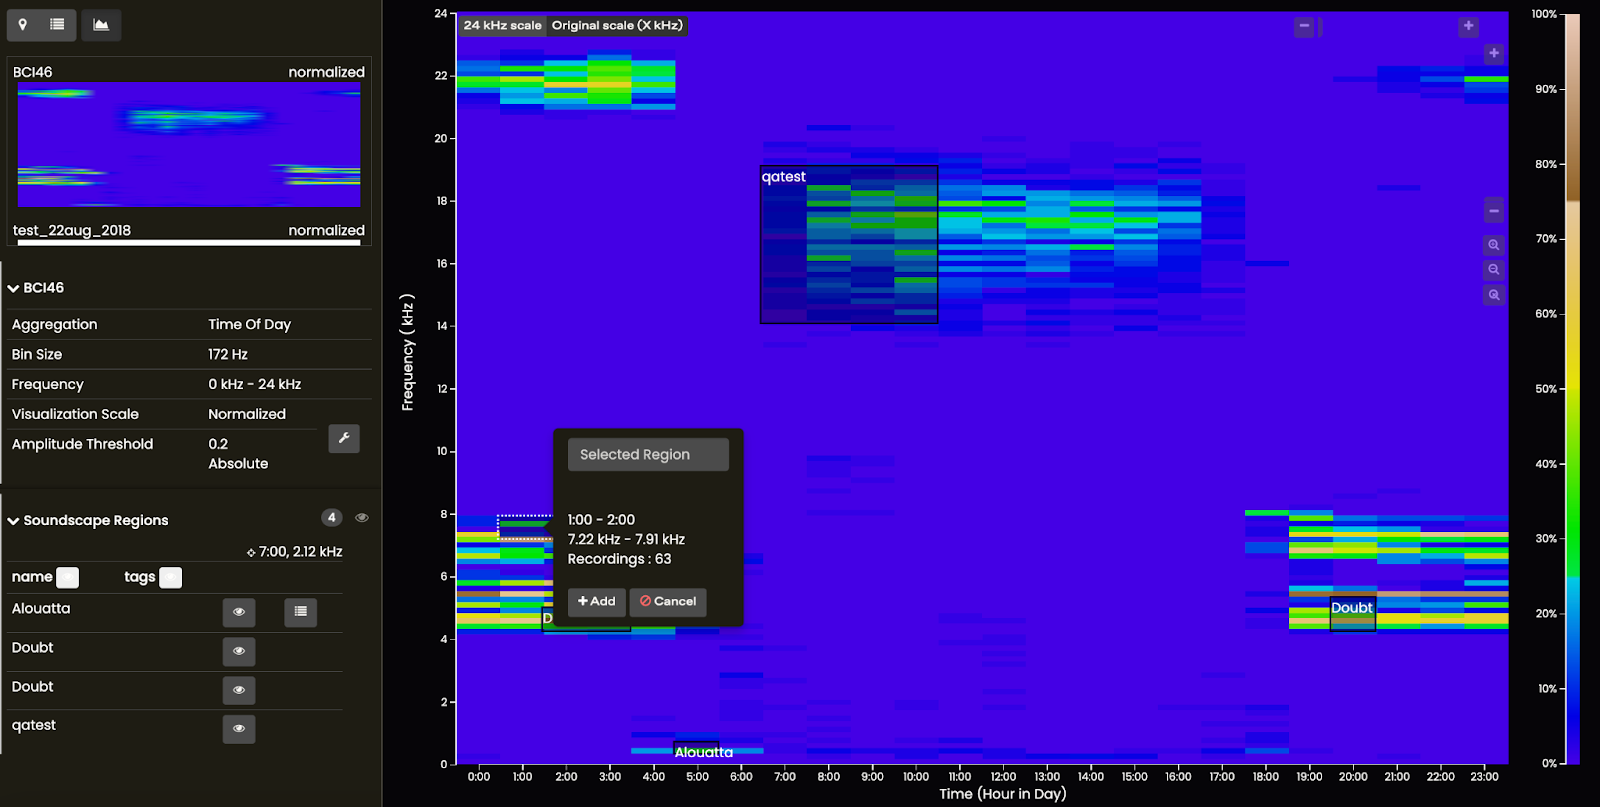
5. To view your soundscape job’s results, click View. A soundscape plot will open, where the color gradient represents where acoustic activity was detected at particular time and frequency bins. You can edit the visualization options by clicking the tool icon.

This will allow you to change the color palette and amplitude threshold.
6. To examine the recordings that contribute to a particular area within the soundscape plot, you can click on the bins of interest. A pop-up will appear where you can assign a name for the sample region (e.g. species name, doubt etc). Click Add.
7. A bounding box will appear around the region you selected. Click on this region, then click Sample.

8. Select what percentage of the total recordings with acoustic activity in that region that you want to inspect.

9. Once you create the sample, click View to inspect the sample recordings.

This will then take you to a spectrogram Visualizer screen where each recording is cropped to the frequency bin of your selected soundscape region.
10. If you want to export the soundscape plot as a spreadsheet (where each cell’s value represents one frequency-time bin), you can do so by going to Soundscape Results then clicking the arrow next to Export.

You have the option of downloading a matrix or the raw data.

Exporting Raw Data will generate a spreadsheet that looks like this.

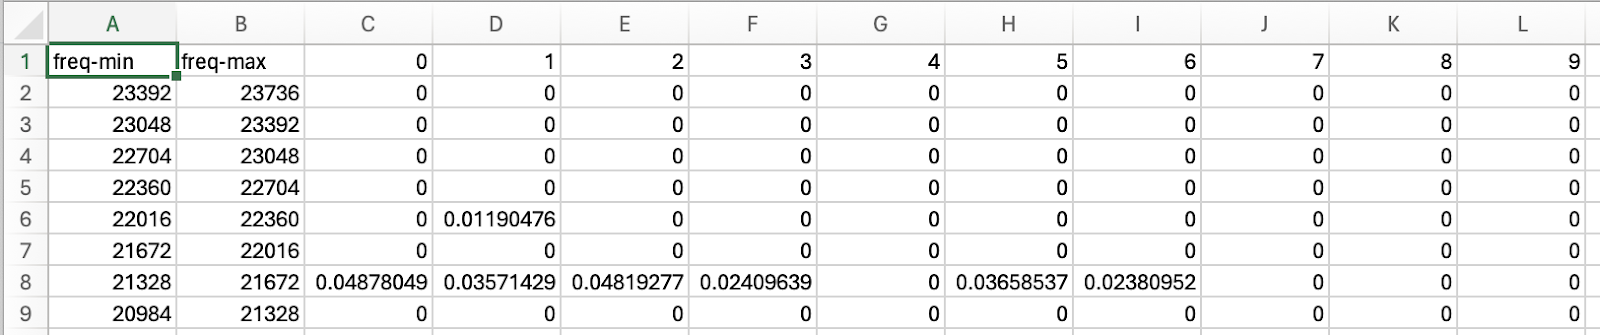
Exporting Matrix will generate a spreadsheet that looks like this (columns are hours of the day, rows are frequency bins).

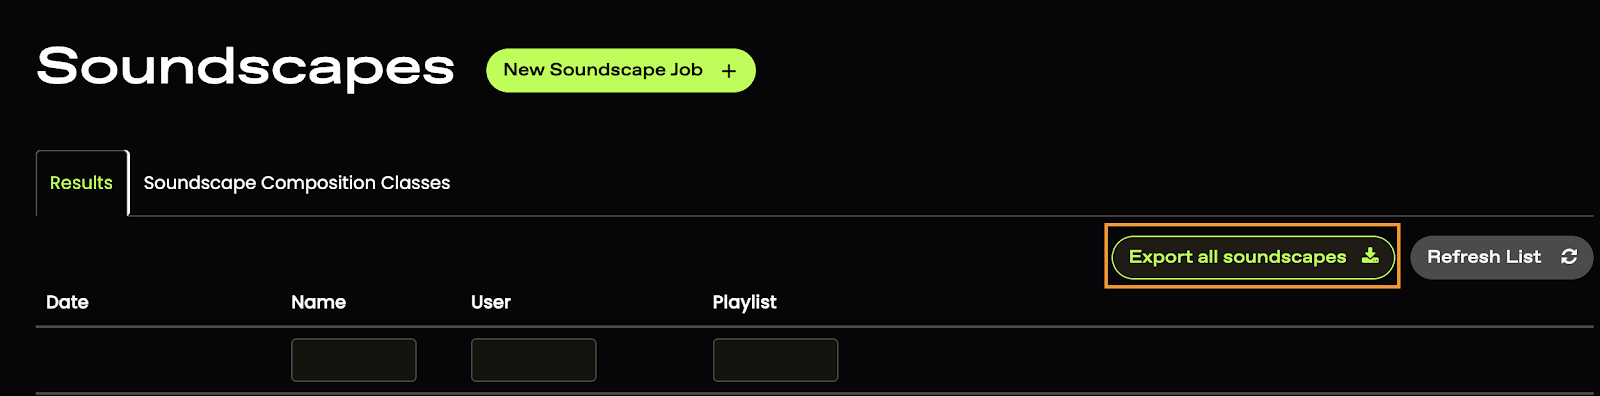
If you want to bulk-download the results of all soundscape jobs from a project, you can do so by clicking the 'Export all soundscapes' button (outlined in orange below). You will prompted to input an email where the export will be sent.
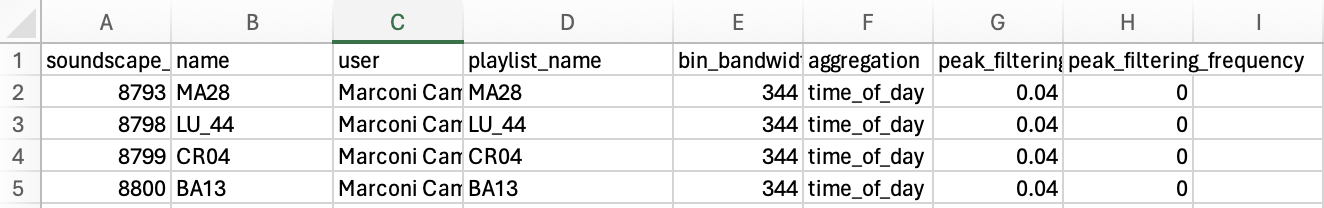
The bulk-export will consist of a zipped folder. This will contain metadata file called 'soundscape.csv' (example below) which contains information about each soundscape job that is included in the bulk-export.
The folder will also have a CSV file and image (PNG) file per job. The PNG file is the soundscape plot for that job.
The CSV file is the soundscape matrix where columns are time bins (usually hours of the day), rows are frequency bins and cells contain the percentage of recordings in that time-frequency bin with acoustic activity (example below).