Visualize Recordings as Spectrograms
What is the Arbimon Visualizer?
Arbimon’s Visualizer tool allows users to view spectrograms (and soundscapes, read more about that here). A spectrogram is a 2-D visual representation of sound.
How to Use the Arbimon Spectrogram Visualizer
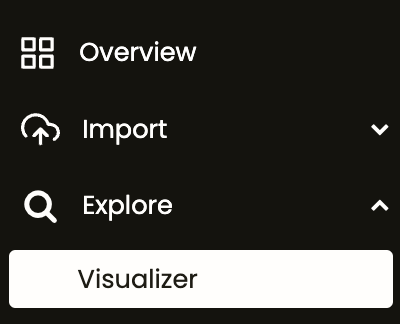
1. Go to the project menu and click Explore, then Visualizer.
2. In the top left corner, you can select if you want to search by site, playlist or soundscape.
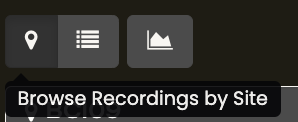
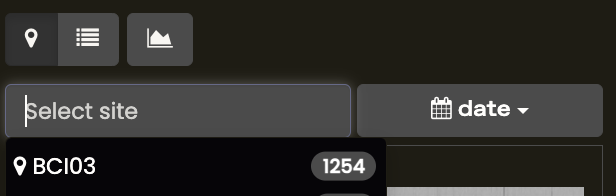
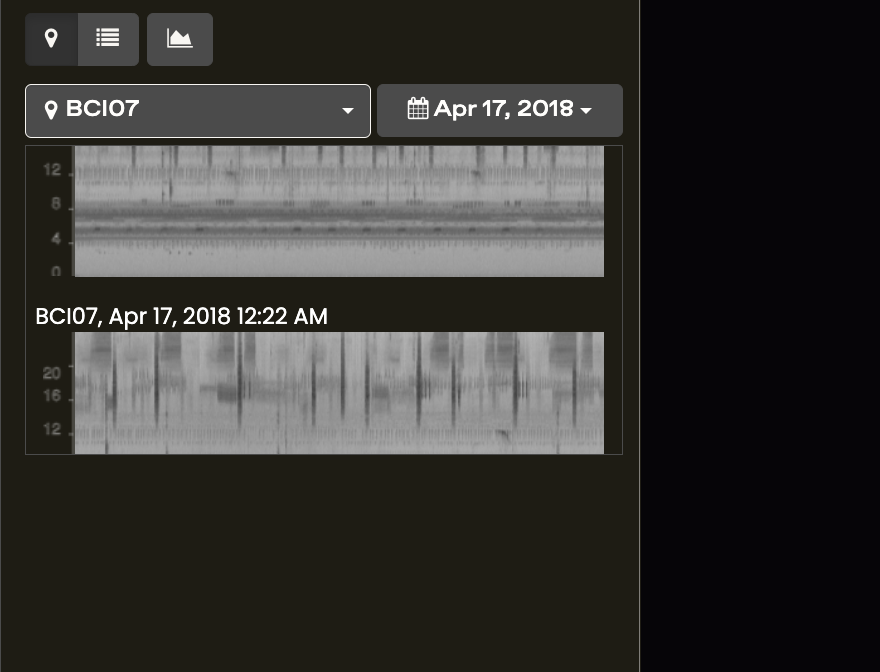
3. When you browse recordings by site, you will need to select a site and then a date.
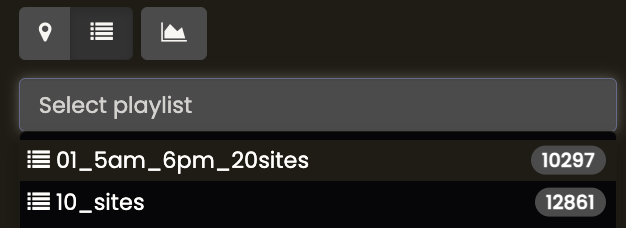
When browsing recordings by playlist, you will be prompted to select a playlist.
4. You will see small spectrogram thumbnails in the upper-left corner which you can scroll through. When you find a recording you want to inspect more, click on it to view it in the larger Visualizer window.
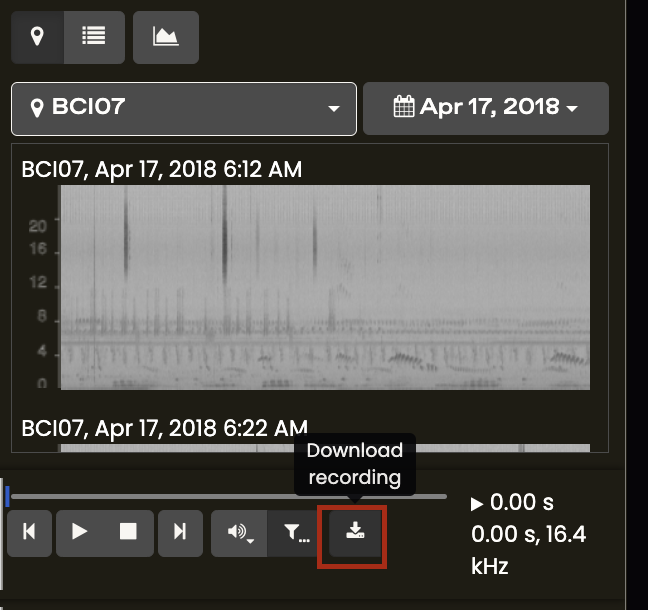
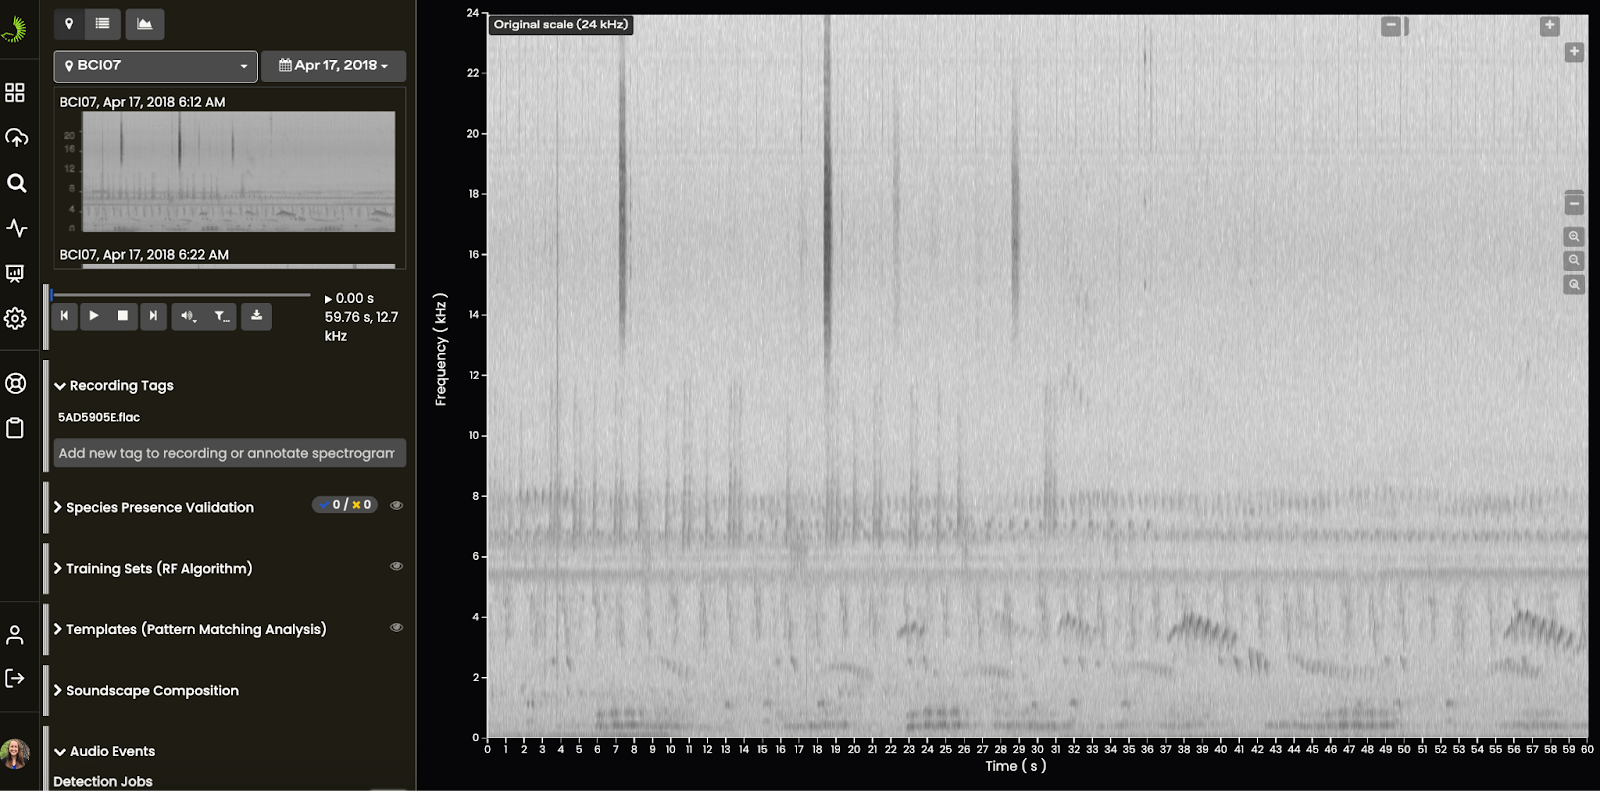
5. The recording will then be open in the larger Visualizer window.
Arbimon Visualizer Settings
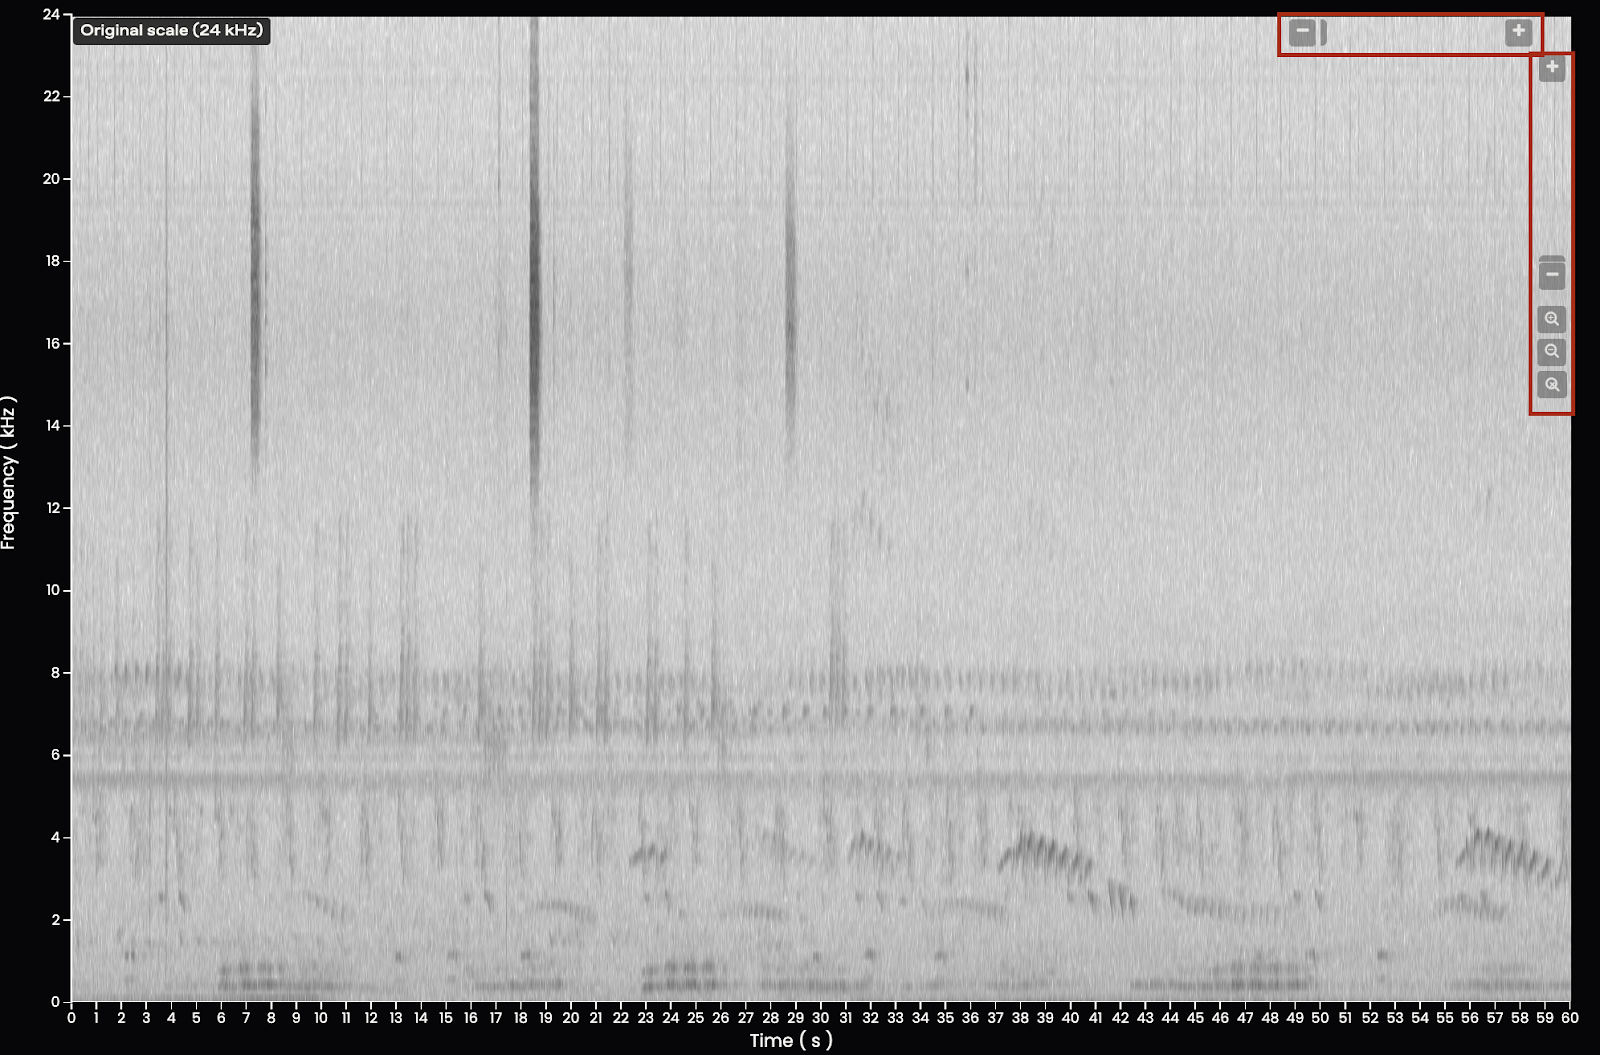
You can zoom in and out on both the horizontal (time) and vertical (frequency) axes.
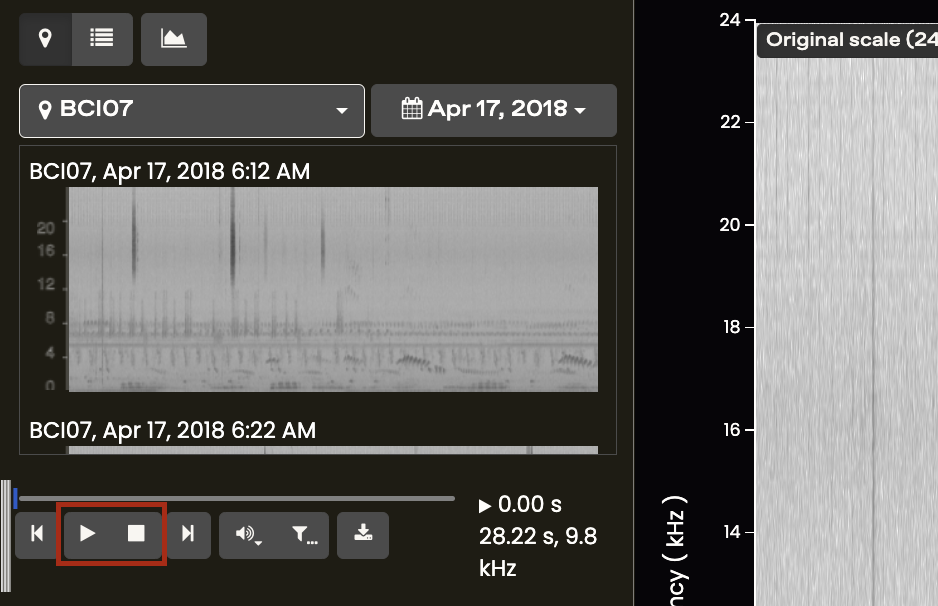
You can play and pause the recording using these icons.
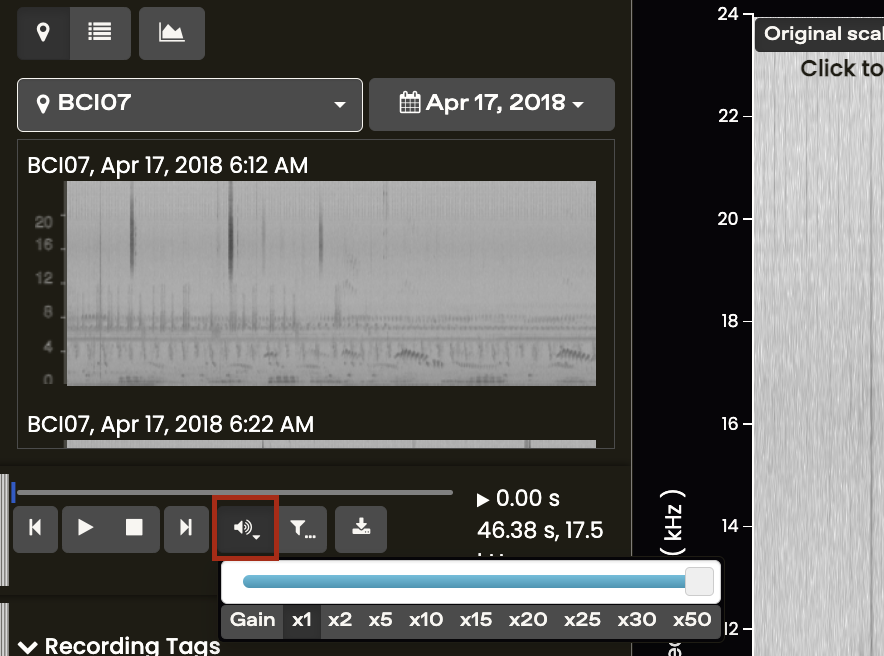
You can increase the amplitude (gain) of the recording by clicking the speaker icon. This will increase the “loudness” of the audio playback and can be helpful when listening to calls that are distant in the recording.
You can filter out particular frequency bands by clicking the filter icon. A pop-up will appear where you can drag the top and bottom limits to narrow in on a particular frequency range. Then click Apply Filter.
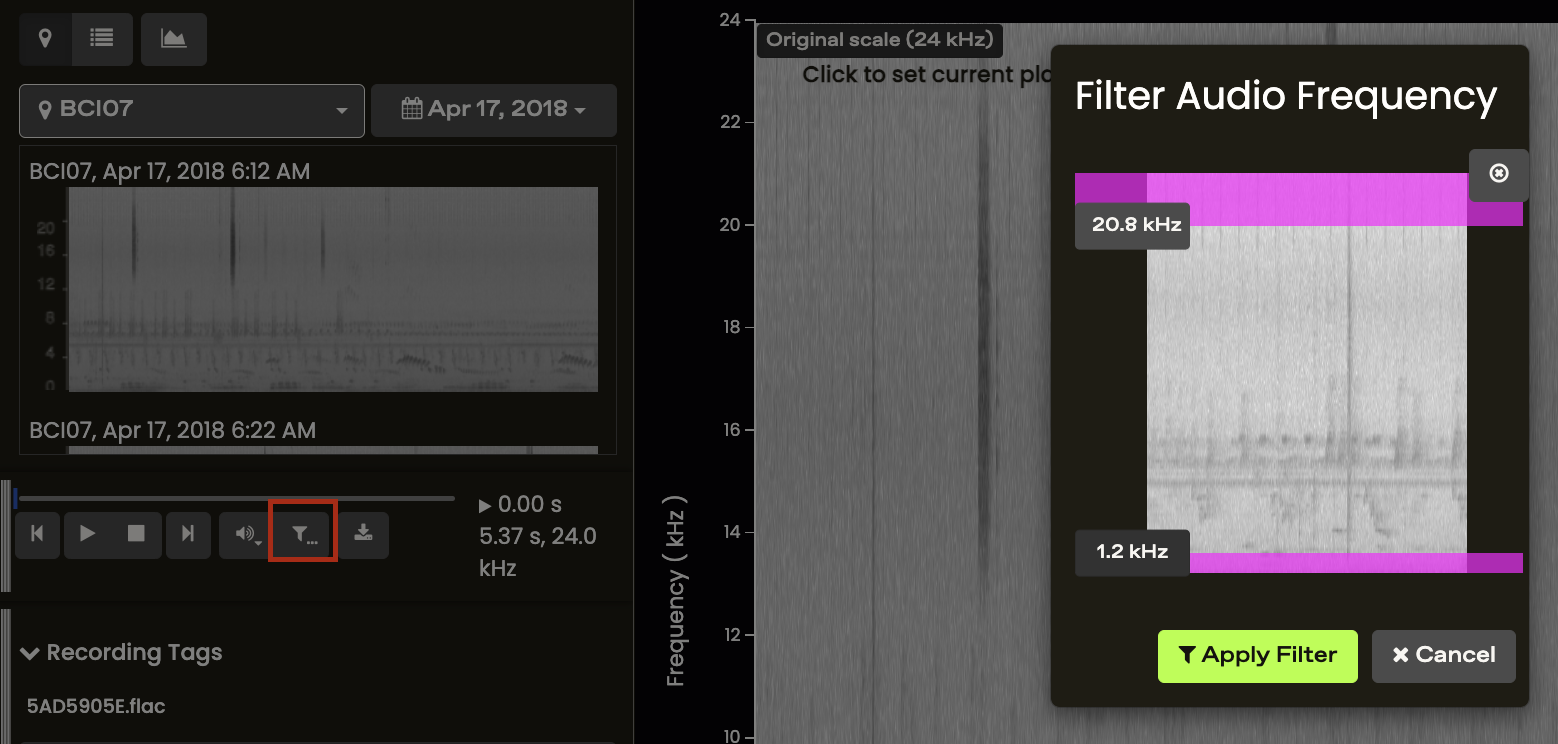
To cancel the filter click on the X button.
You can download that specific 1-minute recording by clicking the download icon.