Creating a Clustering Job
After you have run an AED job, the second step is clustering, where audio events are automatically grouped into clusters based on their acoustic similarities. These clusters can then be easily explored and validated in Arbimon.
How to Run a Clustering Job
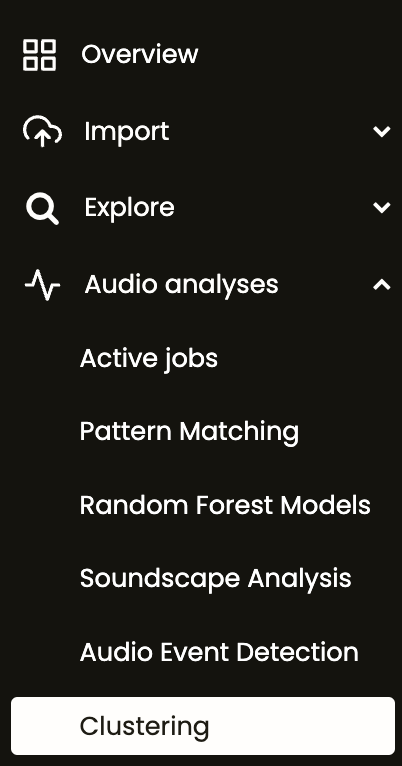
1. Go to the project menu and click on Audio analyses, then Clustering. Click New Job.

2. Set the parameters for the Clustering job
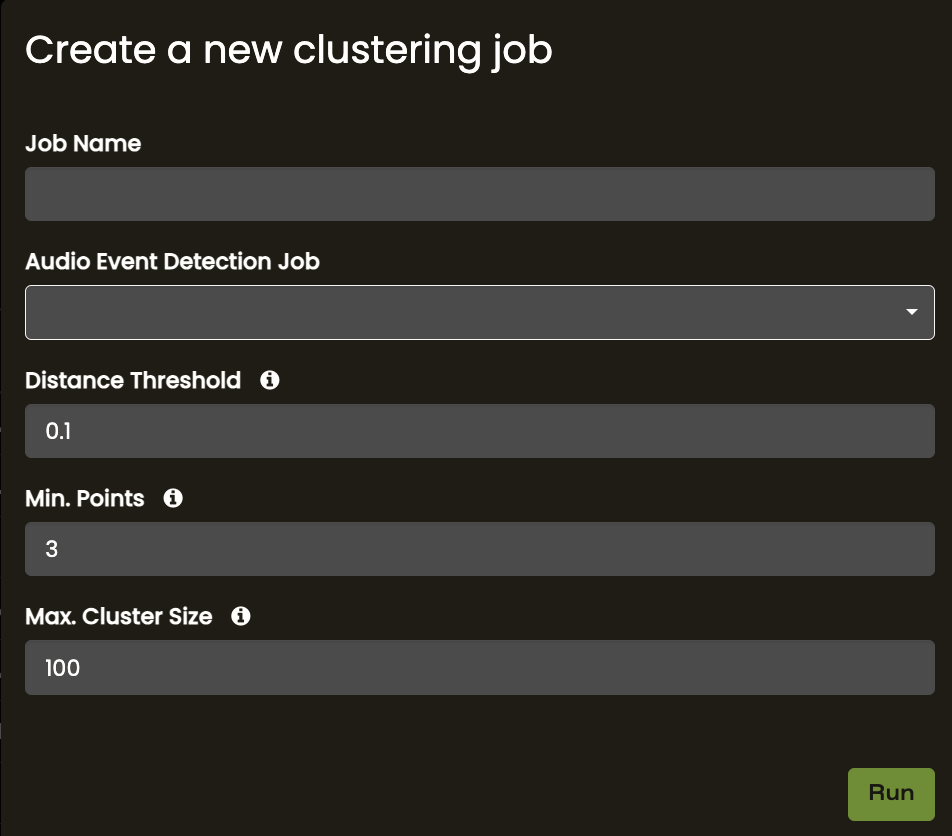
- Audio Event Detection Job - The name of the Audio Event Detection job you would like to cluster the results of
- Distance Threshold - the maximum allowed distance between neighboring points in a cluster. This parameter will likely have the most significant impact on results.
- Smaller values will result in smaller, more homogeneous clusters, and vice versa (see Table 1).
- Based on our feature set and distance function used to compare AEDs, appropriate values are likely to be 0.05-0.20. See Parameter Examples below.
- Min. Points - The lowest number of points required to form a cluster.
- If small clusters (e.g. rare sounds) are of interest, it is recommended to keep this at a low value (<=5). Larger values will restrict the results to more densely populated clusters.
Table: Effect of the Distance Threshold parameter
| Distance Threshold | Similarity of audio events in a Cluster | Number of Clusters | Size of Clusters |
| Lower | Higher | Higher | Lower |
| Higher | Lower | Lower | Higher |
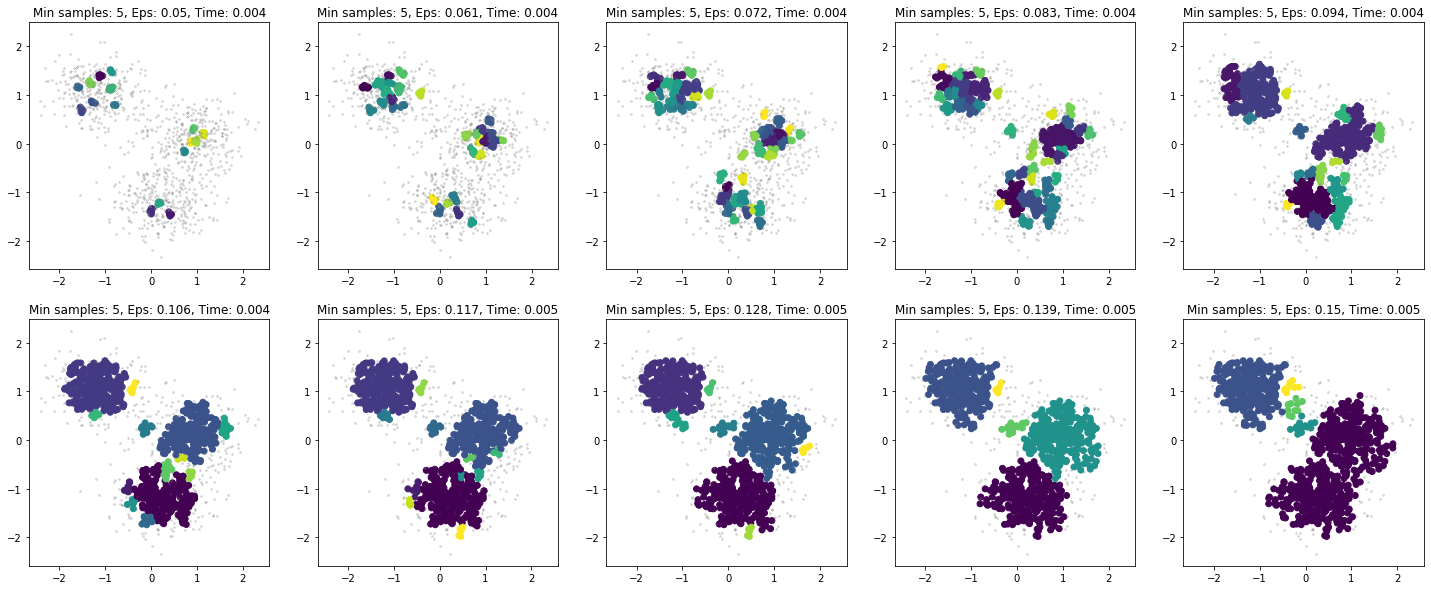
Example showing varying Distance Threshold (0.05 to 0.15) with same # of Samples (5)
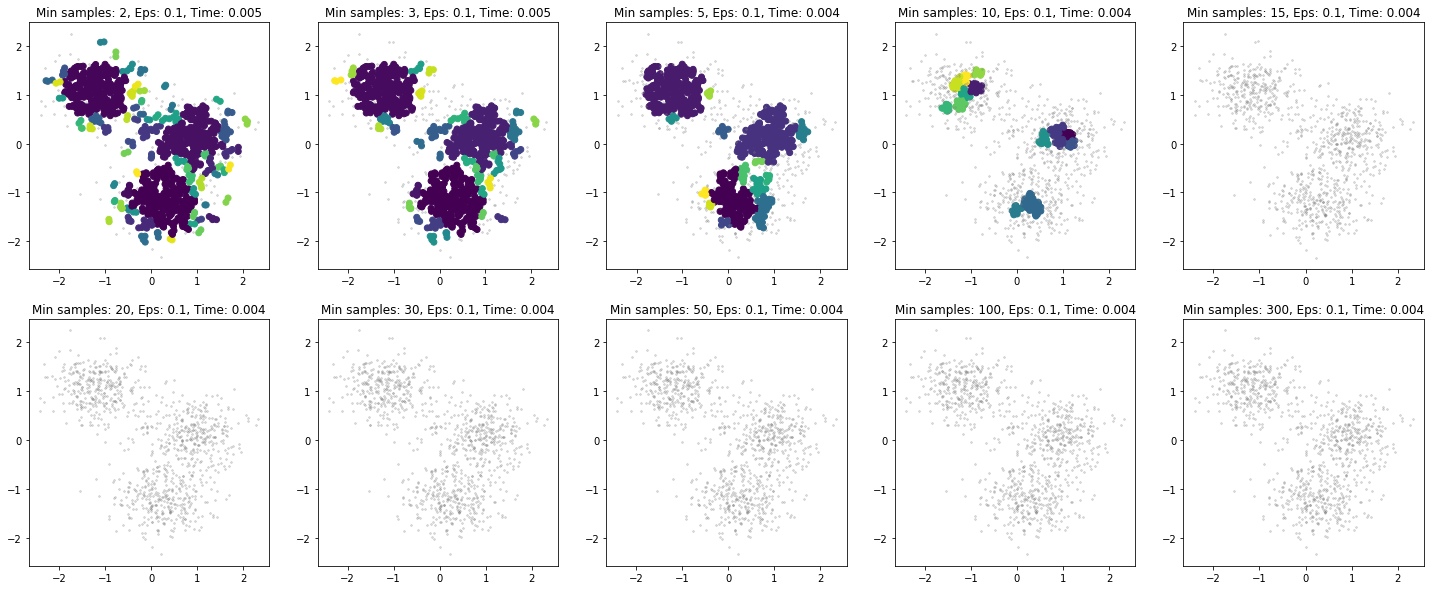
Example showing varying Min. # of Points (2 to 300) and same Distance Threshold (0.1)
For more details about the clustering algorithm and parameters, see the original DBSCAN paper.
3. After you have finished selecting the parameters, click Run.
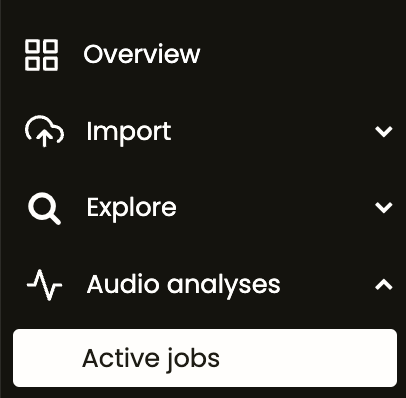
You can view the status of the job by going to the project menu and clicking Audio analyses, then Active Jobs.
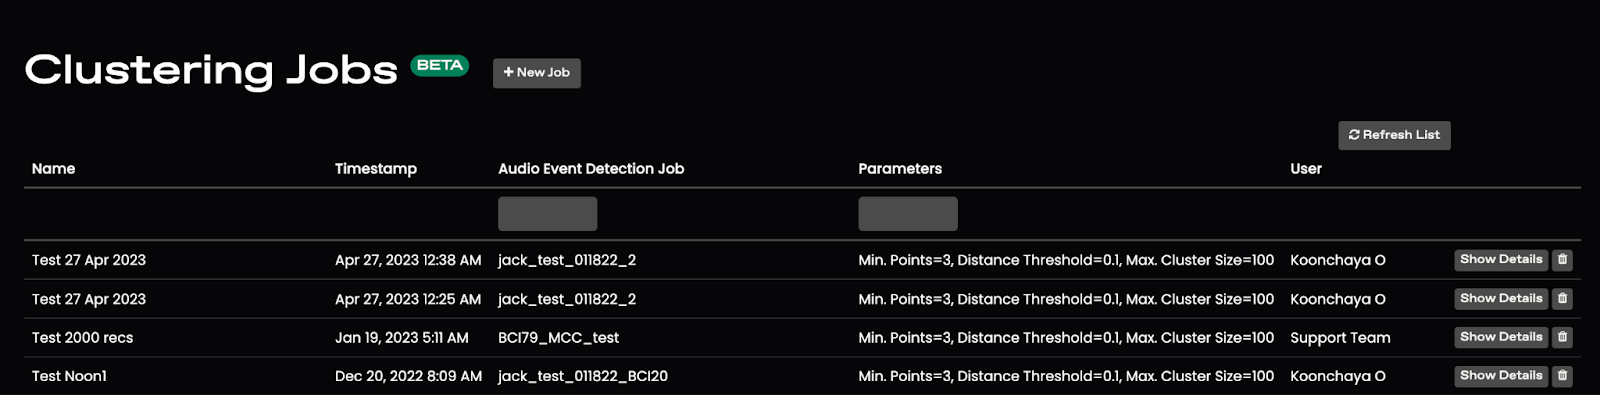
4. Once your job is completed, it will be listed on your Clustering page. Click Show Details to explore the clusters.
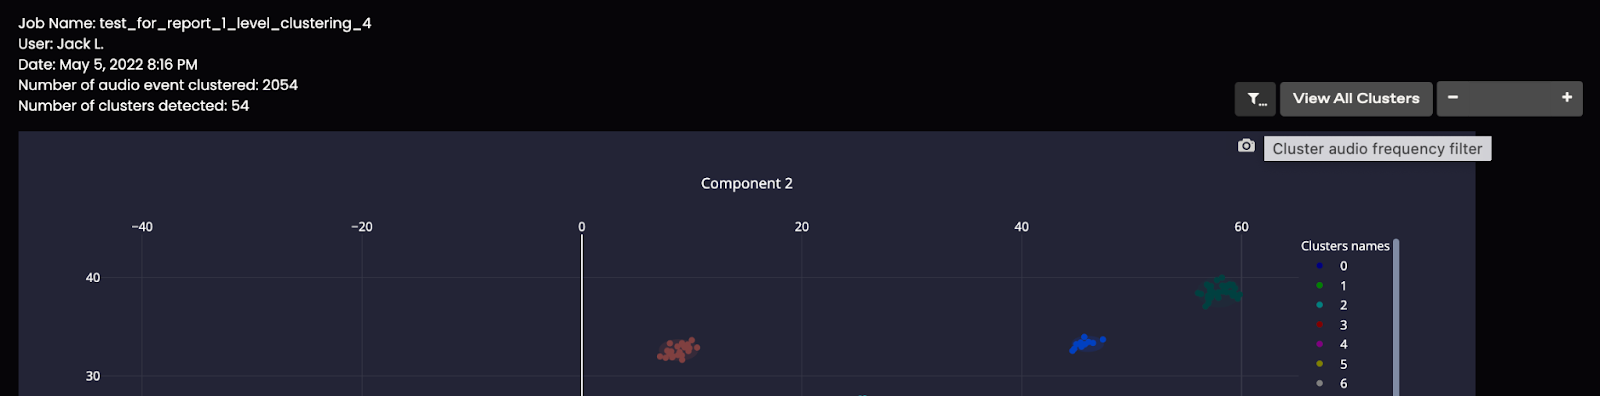
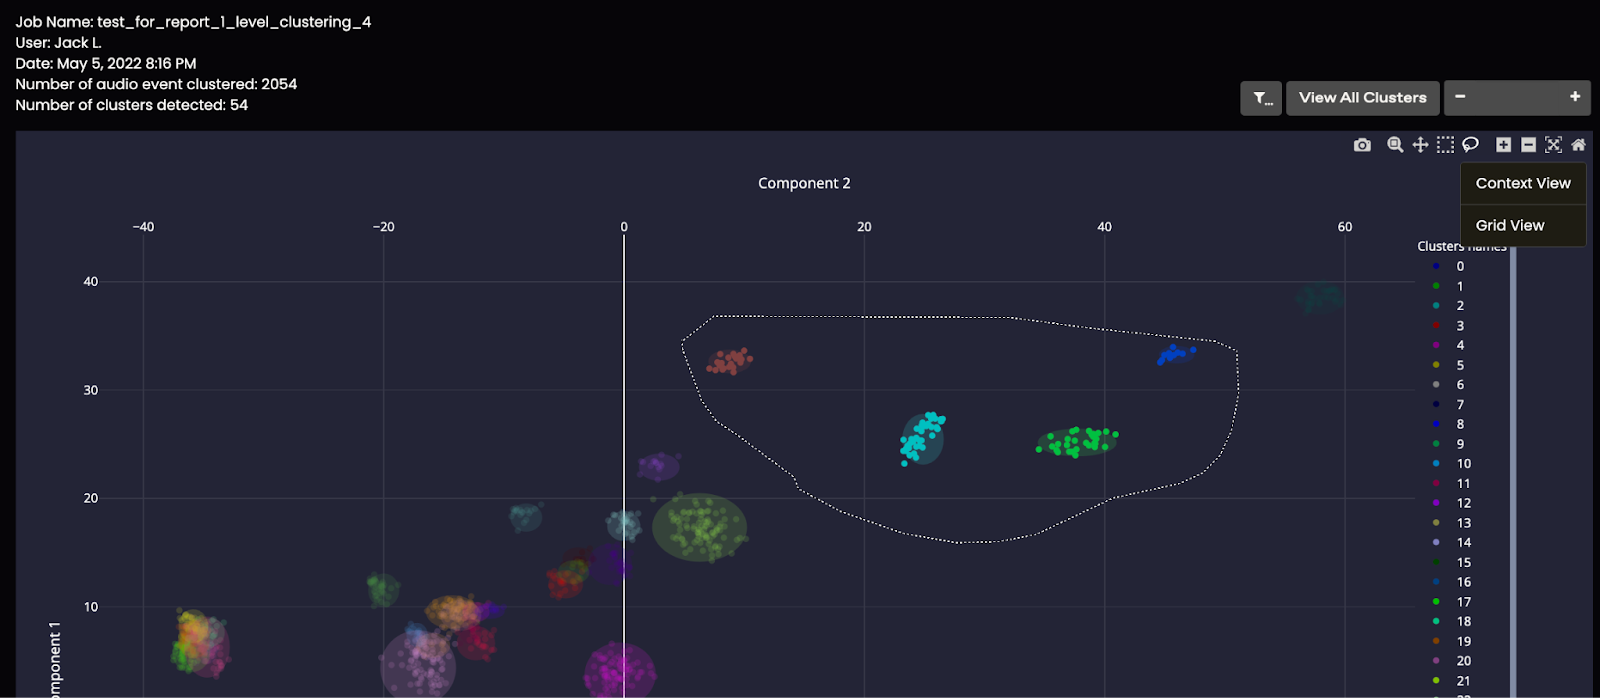
5. This will open a scatter plot that visualizes the clustered audio events. Each point in the scatter plot represents an audio event, and their color indicates their assigned cluster. Nearby points/clusters are more similar than ones that are distant from each other.
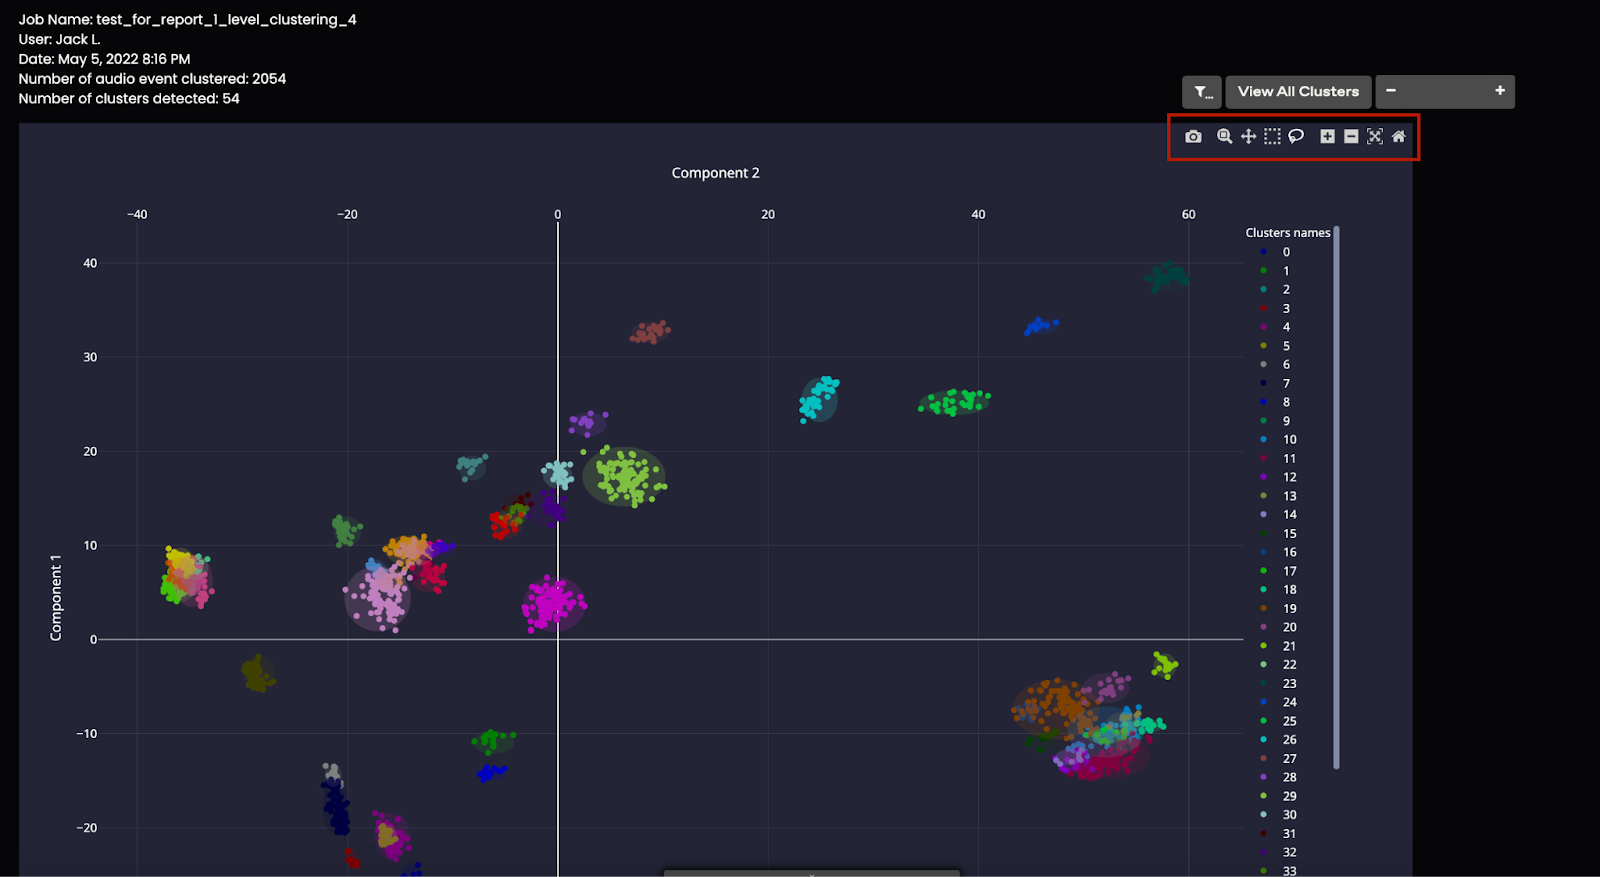
There are a suite of tools to help you explore the scatterplot and the clusters.
By selecting the filter icon, the displayed audio events can be filtered to those within a specific frequency range.
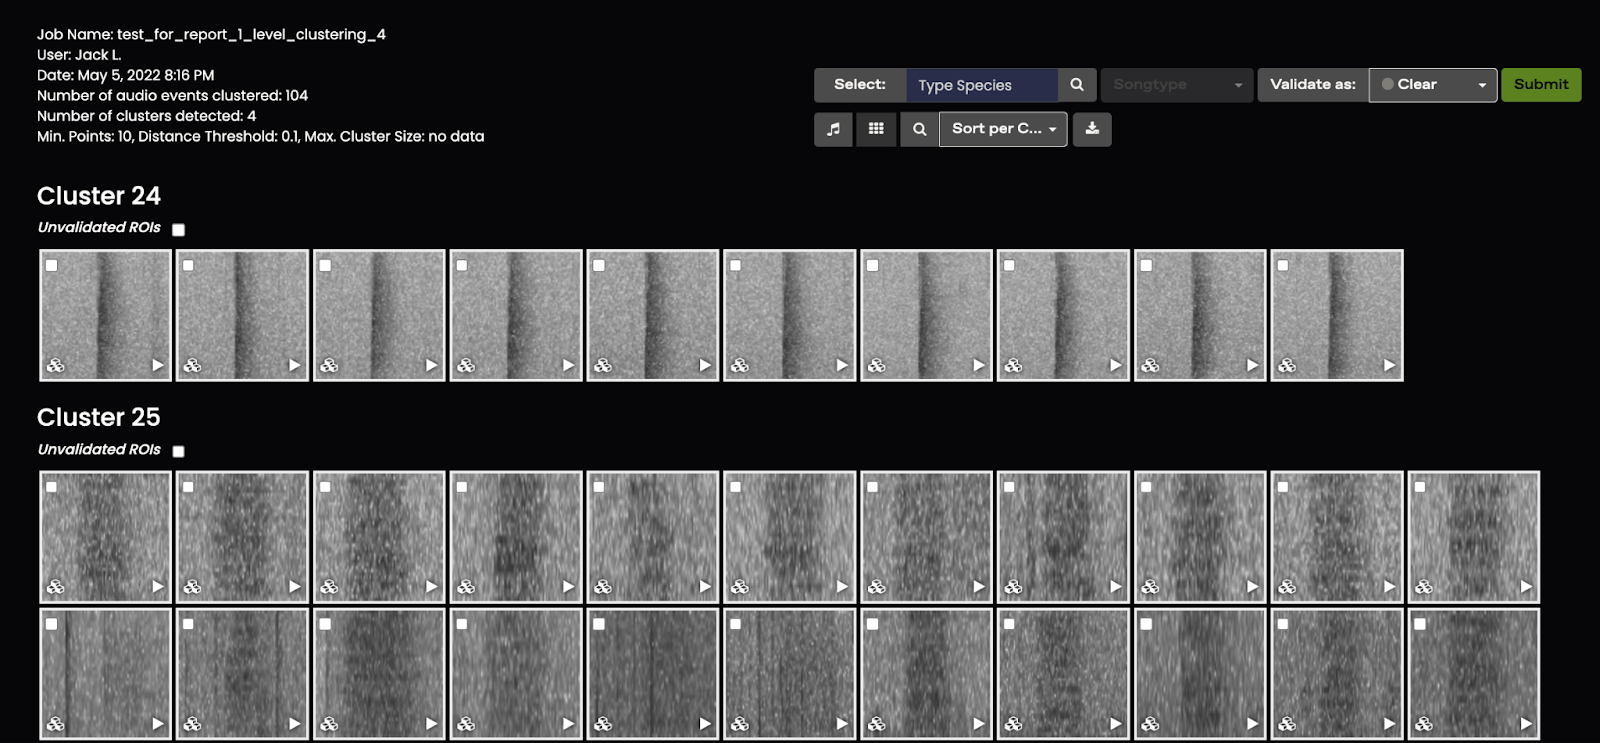
6. To explore which audio events comprise each cluster (either all clusters or those selected with the lasso tool), click View Clusters, then choose between Grid View (what we recommend) or Context View. Audio events can also be grouped by site and date.
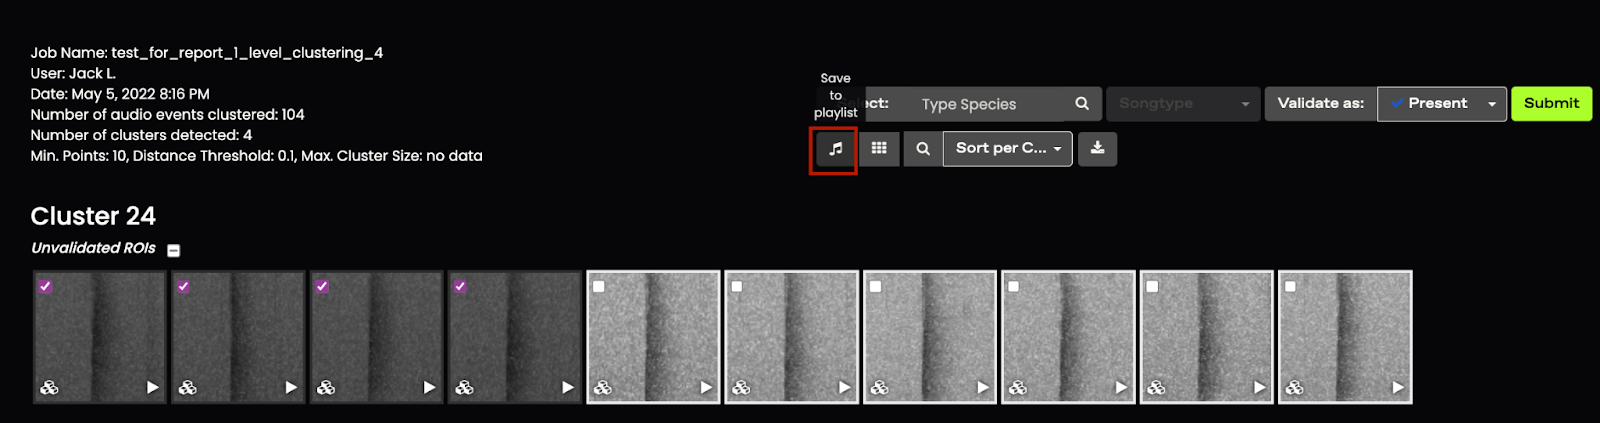
You will see spectrogram clips of the audio events that comprise each cluster
7. You can validate clusters as a species by selecting audio events you want to validate, selecting a species and song type, choosing to Validate as __, and clicking Submit.
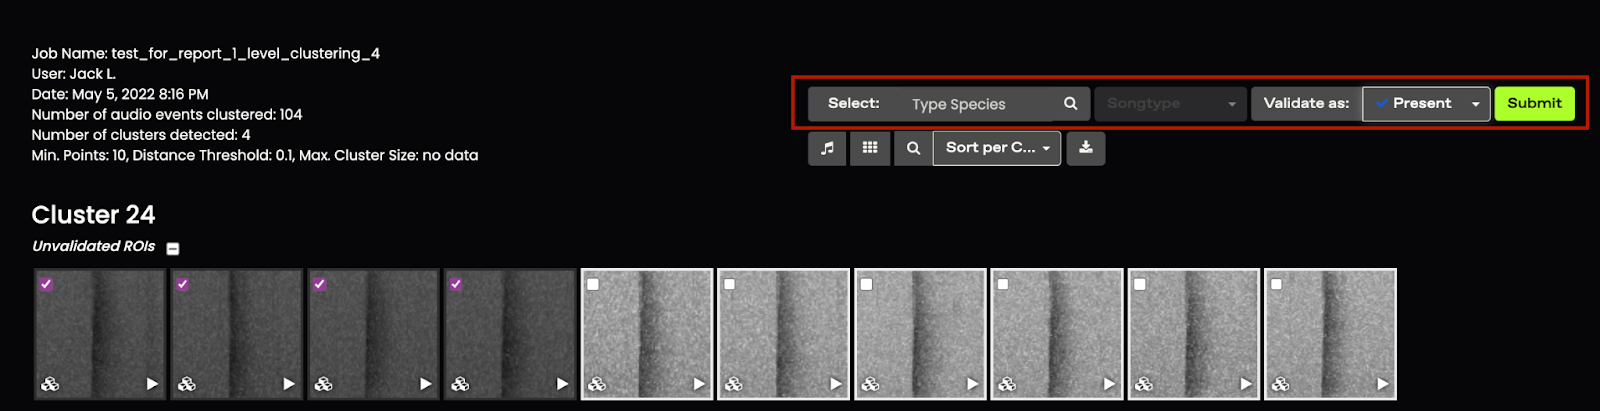
8. You can save selected audio events to a playlist by clicking the note icon.