Using the Insights Richness Page
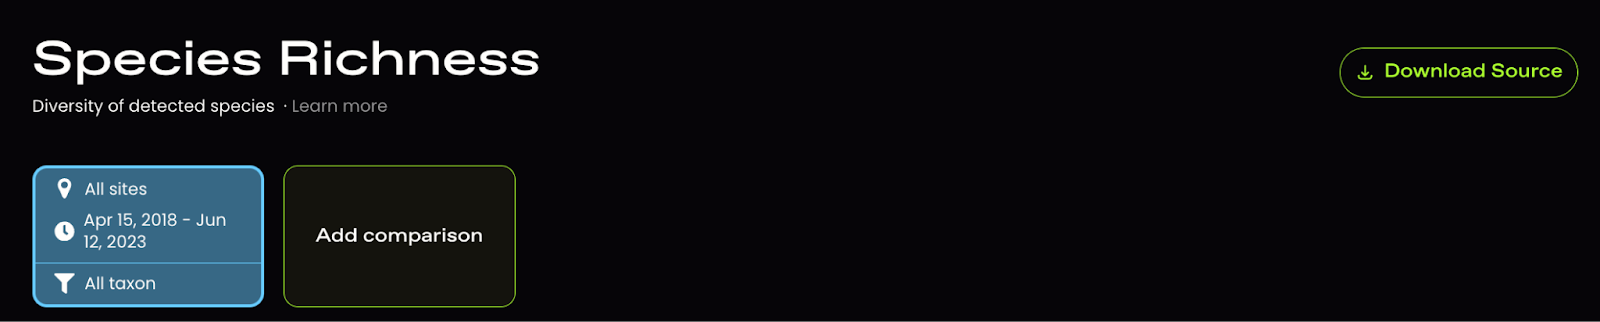
Species Richness
Species richness is one of the simplest, most common, and for many, most intuitive metrics to summarize biodiversity. It is widely used for ecological and conservation applications, such as identifying global hotspots of biodiversity, establishing priority areas for conservation, and assessing how biodiversity varies along environmental gradients.
This Richness Insights page presents figures and tables showing the number of species detected across sites and timeframes, and allows for the exploration of those data in greater detail.
Explore the Insights Richness Page
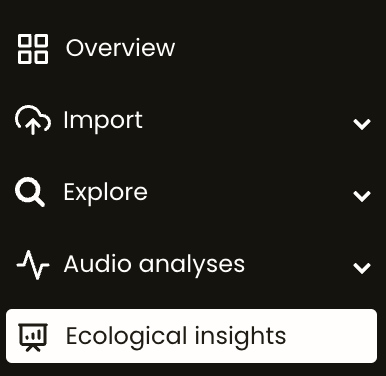
1. Go to the project menu and click Ecological Insights. Select the Richness tab.

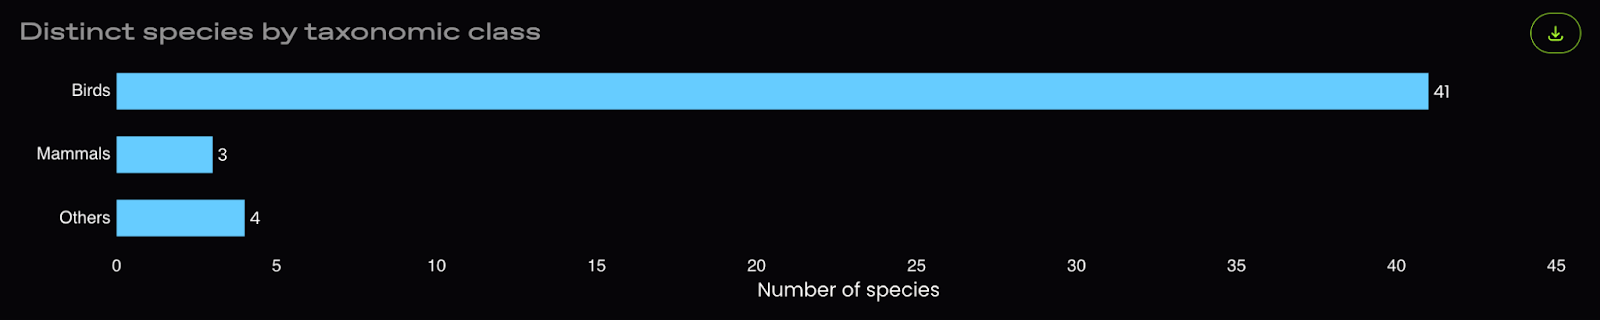
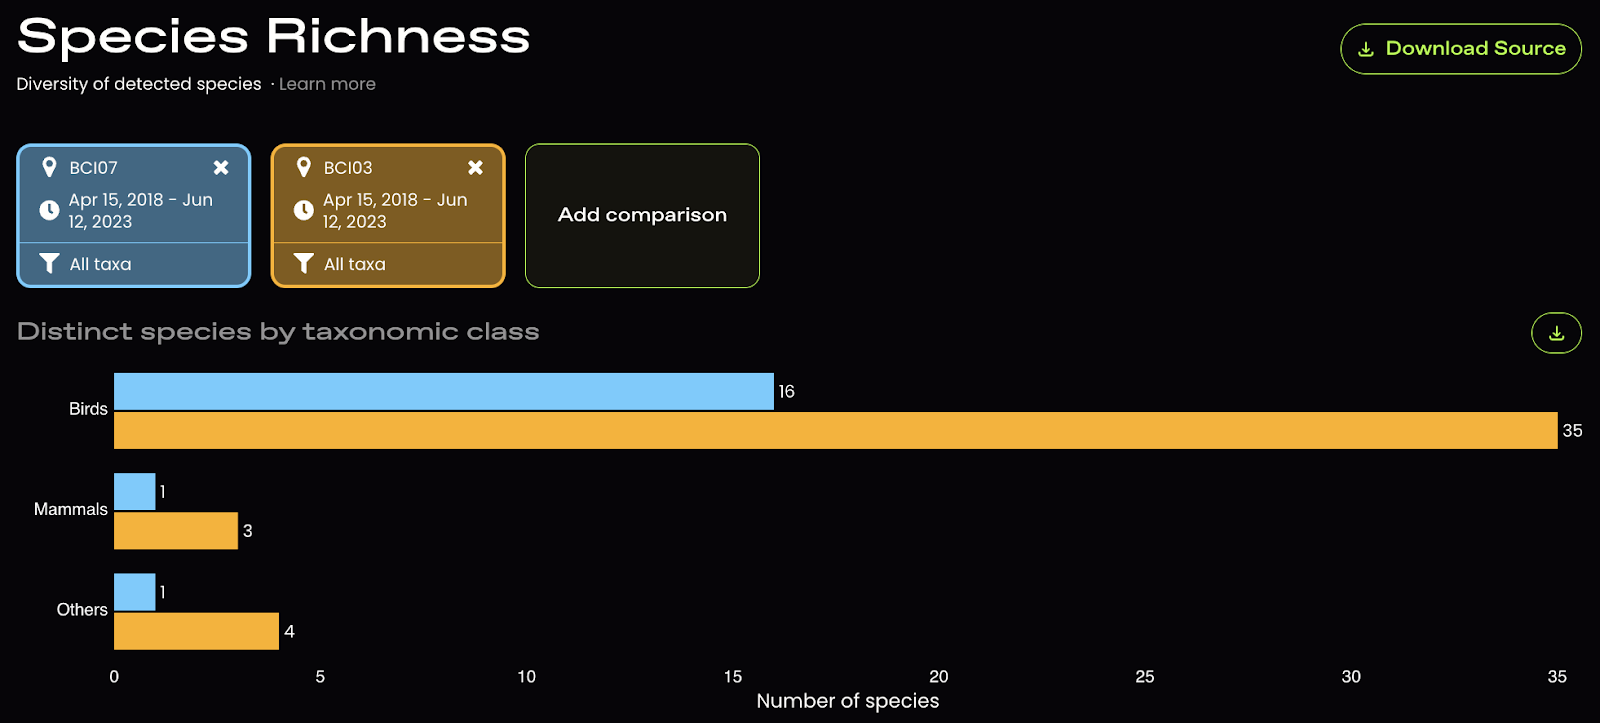
The first graph shows the taxonomic breakdown of species detected (e.g., birds vs. mammals vs. amphibians).
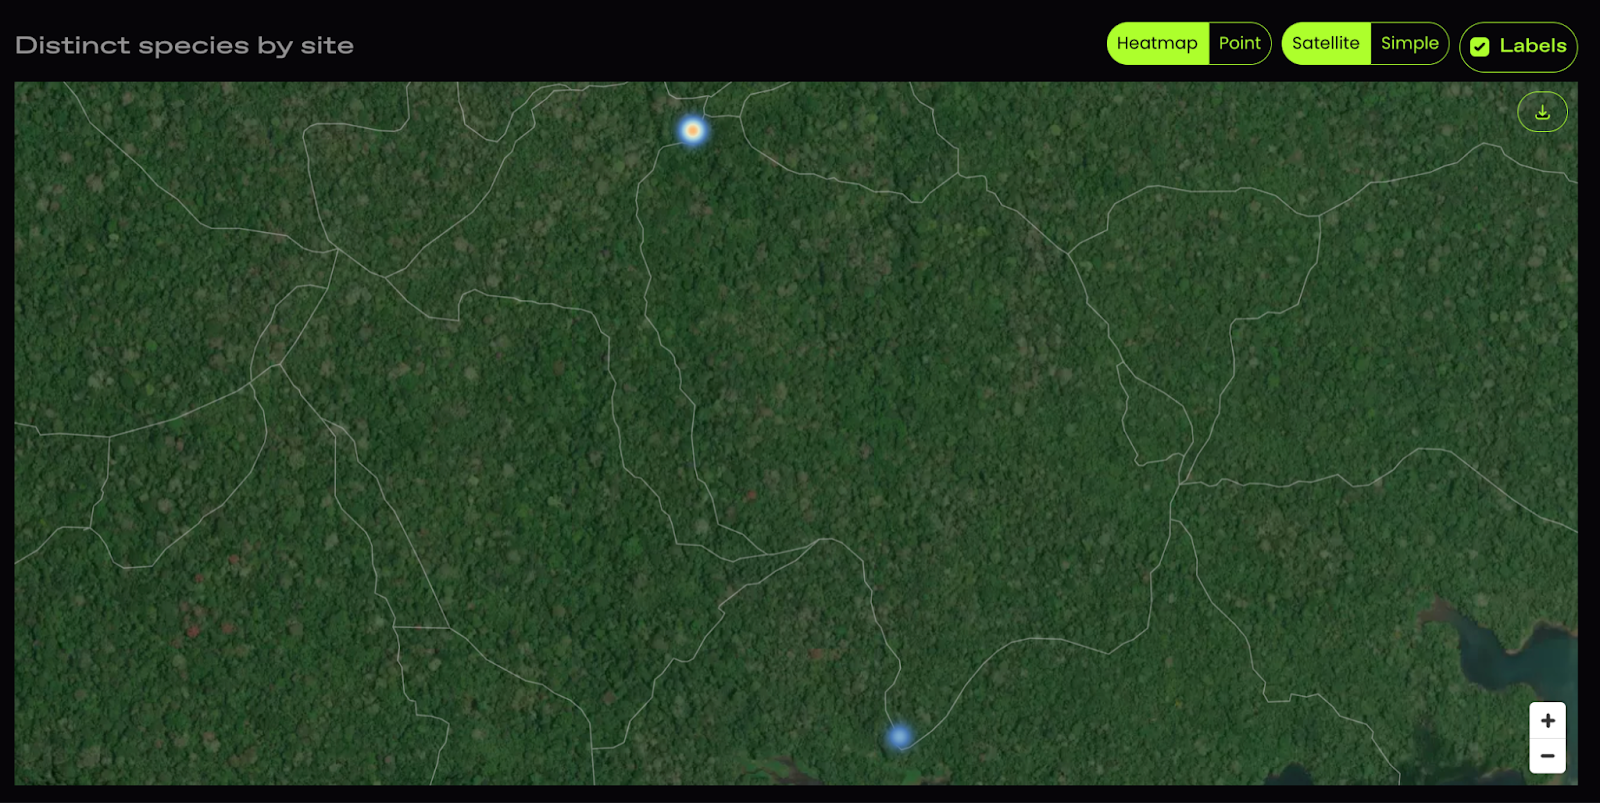
Next, there is a map depicting species richness across sites, with point size reflecting the number of species detected at each location. If you hover over the points on the map, you will see the number of species in each taxonomic group detected at that site.
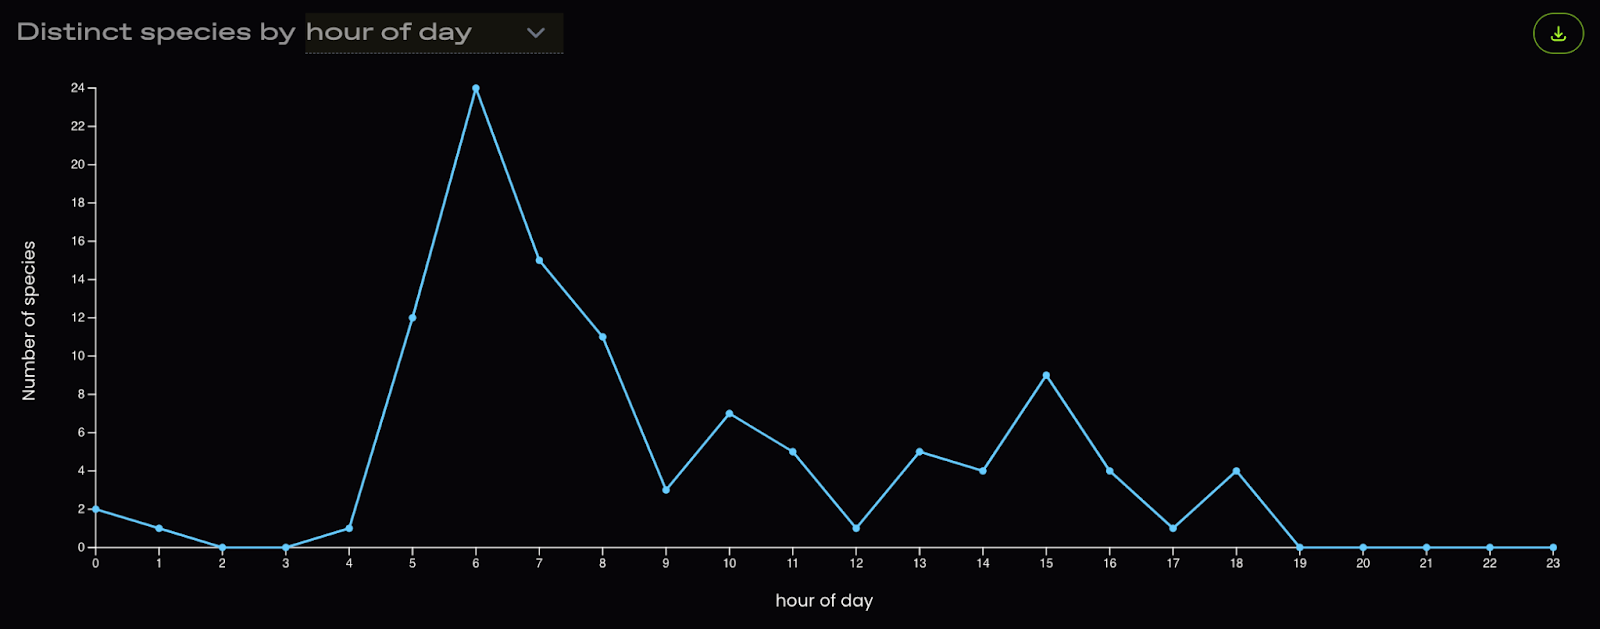
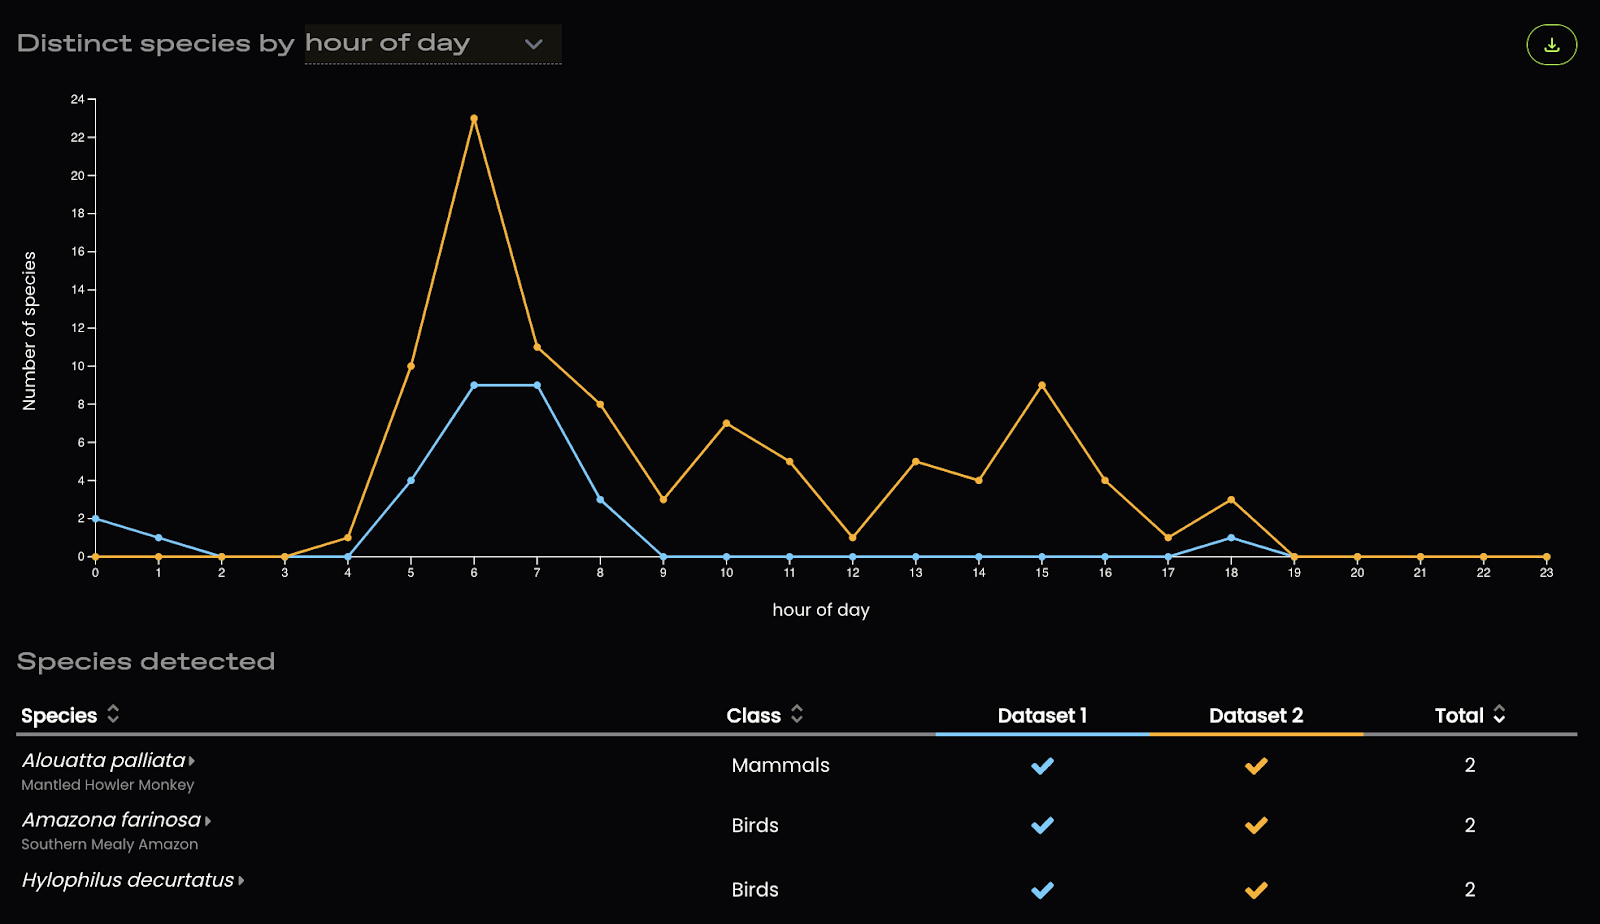
Next, there is a graph displaying the number of species over different time frames (choose between time of day, month of the year, etc.).
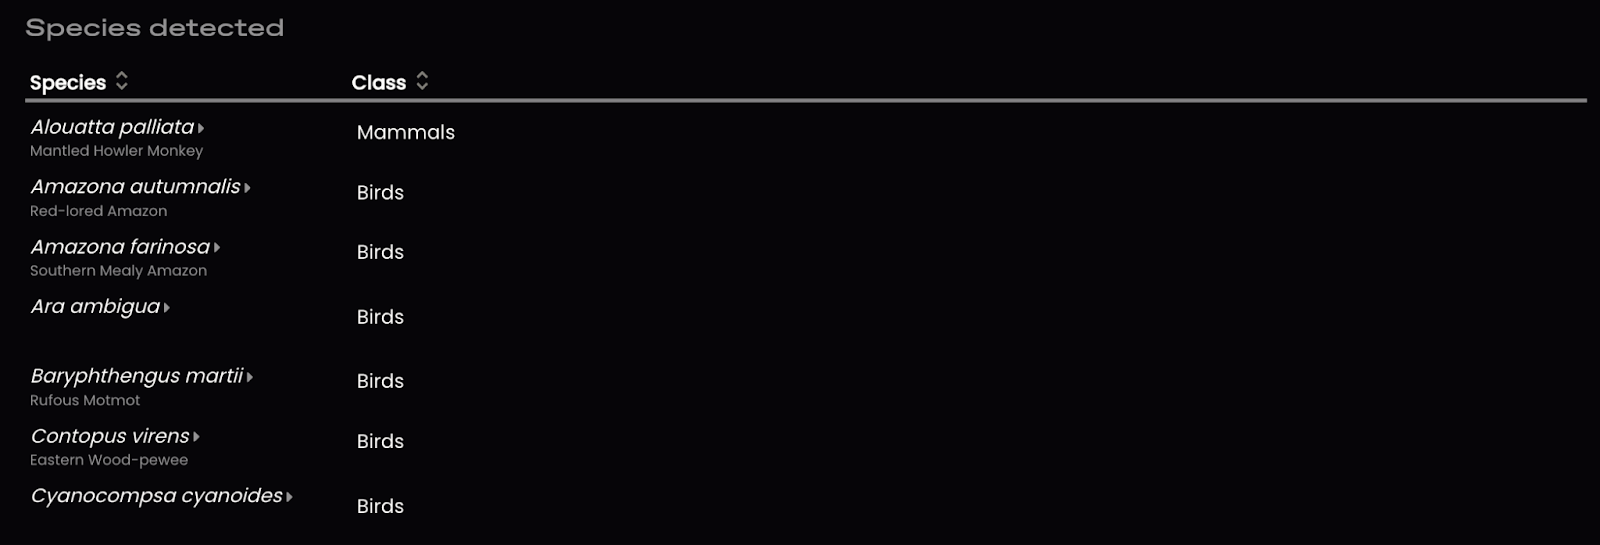
Finally, there is a table showing all the detected species, which can be sorted by species name and taxonomic group.
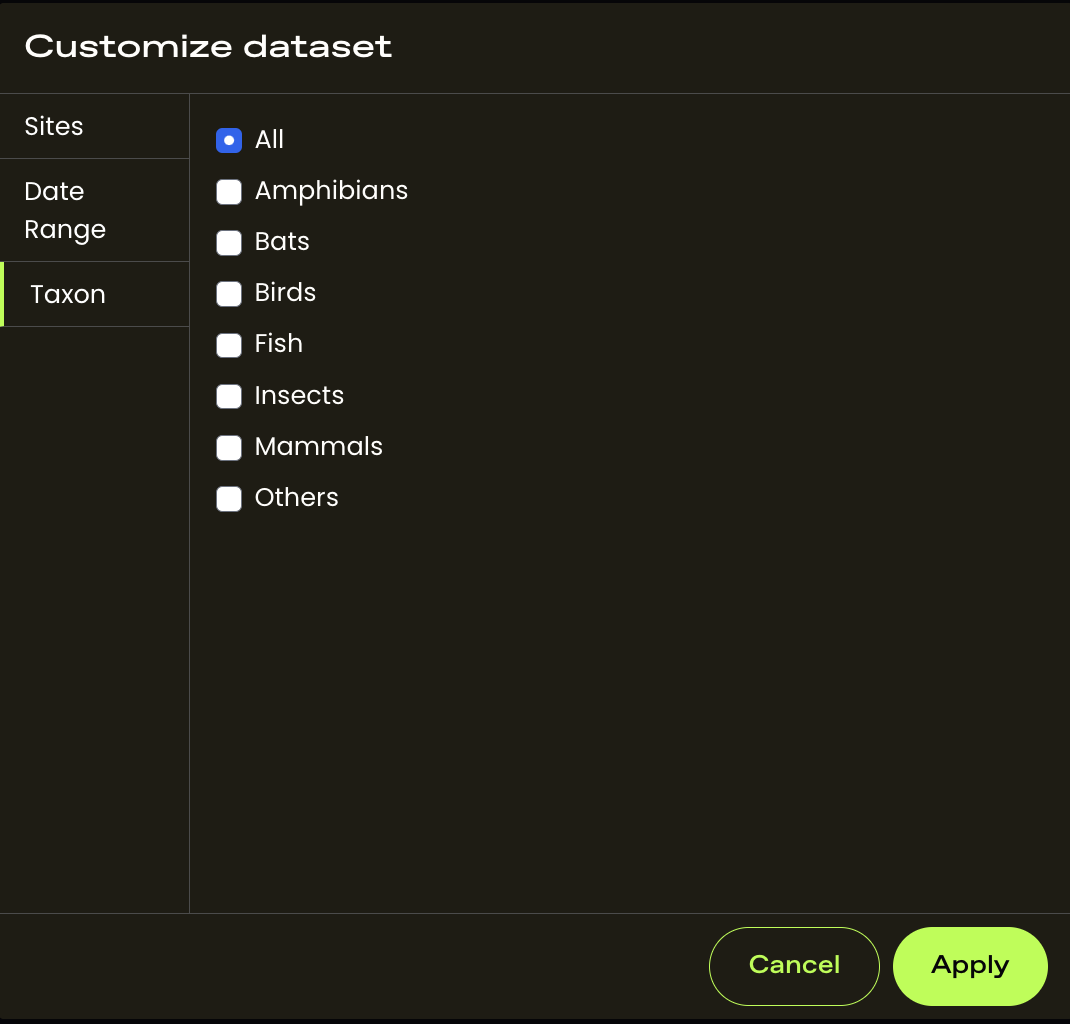
Like the other Insights pages, you can create side-by-side comparisons by subsetting the data by site, date range, or taxa.
The comparisons will then show up like this:
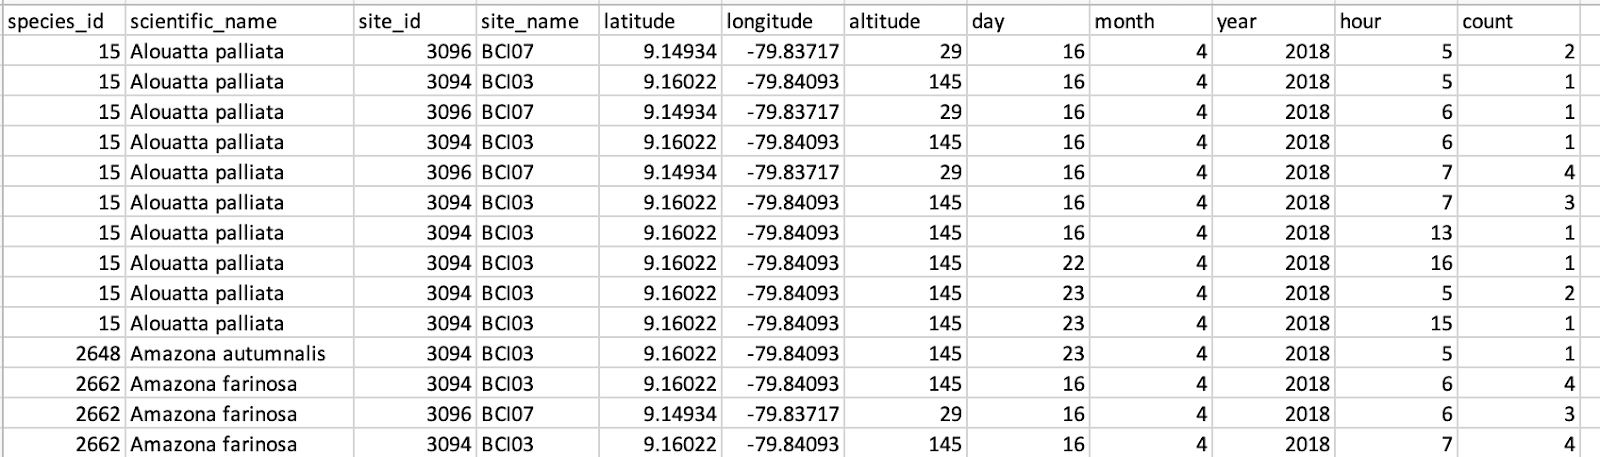
You can download the data that is used to create these figures as a spreadsheet by clicking the Download Source button on the top-right of this Spotlight page.
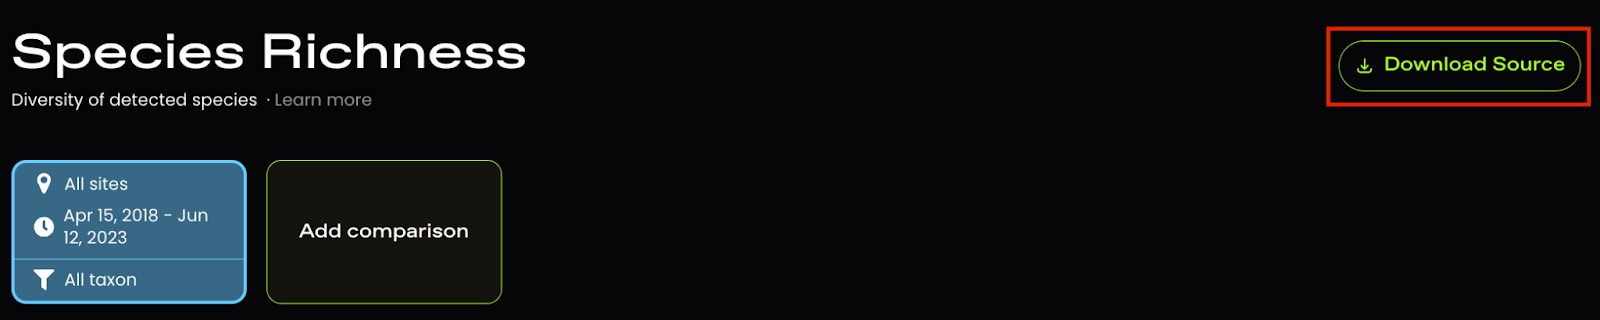
This will download a file that looks like this: