Using the Insights Activity Page
Vocal Activity Patterns
Patterns of vocal activity provide information about vocalizations and their function. In many species, vocal activity can provide insight into breeding cycles since vocal activity often reaches its peak during territorial and mating competition. Knowledge of vocal activity patterns may assist with wildlife management decisions by:
- guiding when to focus monitoring efforts to coincide with when species are most active
- providing a behavior baseline that can be used to track and understand responses to natural and human impacts
- providing information on when to minimize anthropogenic noises that may disrupt a species' ability to communicate
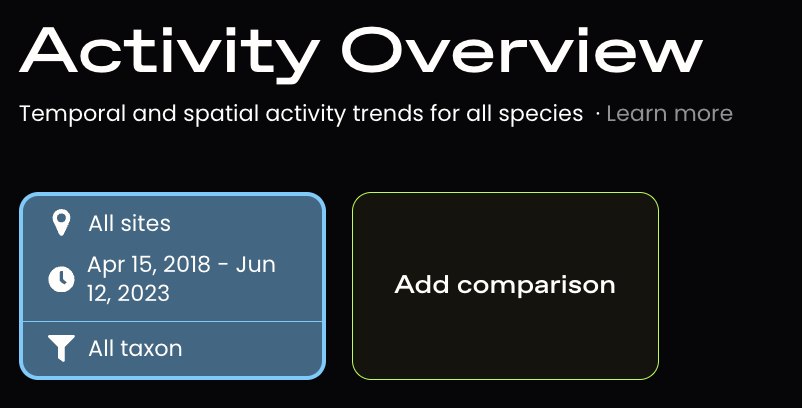
This page offers an overview of temporal and spatial vocal activity patterns in your project, with a focus given to general patterns at the community level.
Explore the Insights Activity Page
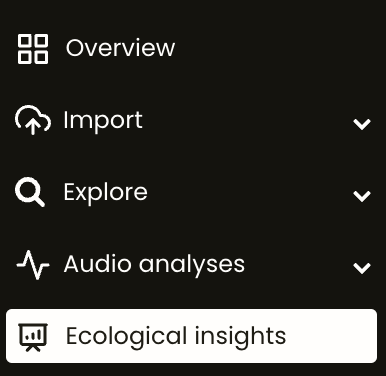
1. Go to the project menu and click Ecological Insights. Select the Activity tab.

First, there is a map depicting detection frequency across sites, with point size reflecting the number of detections at each location.
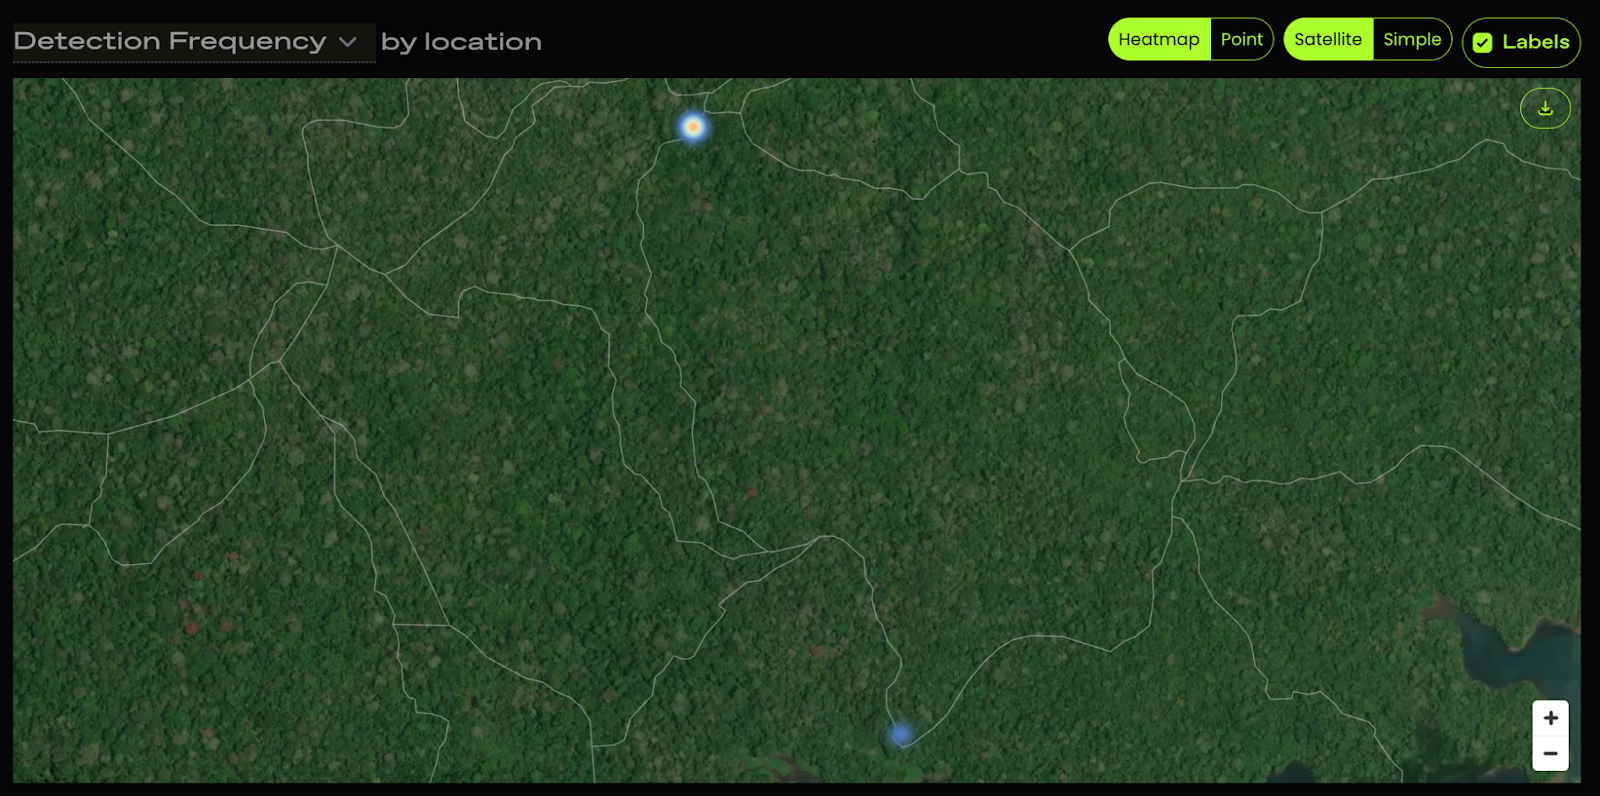
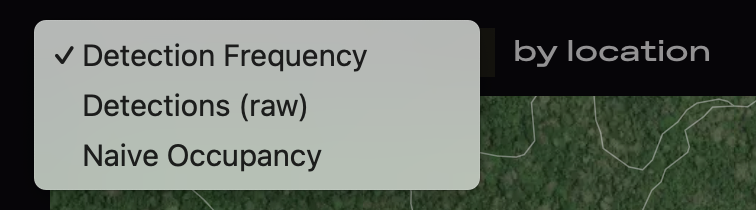
You can view this map using detection frequency, total number of detections, or naive occupancy.
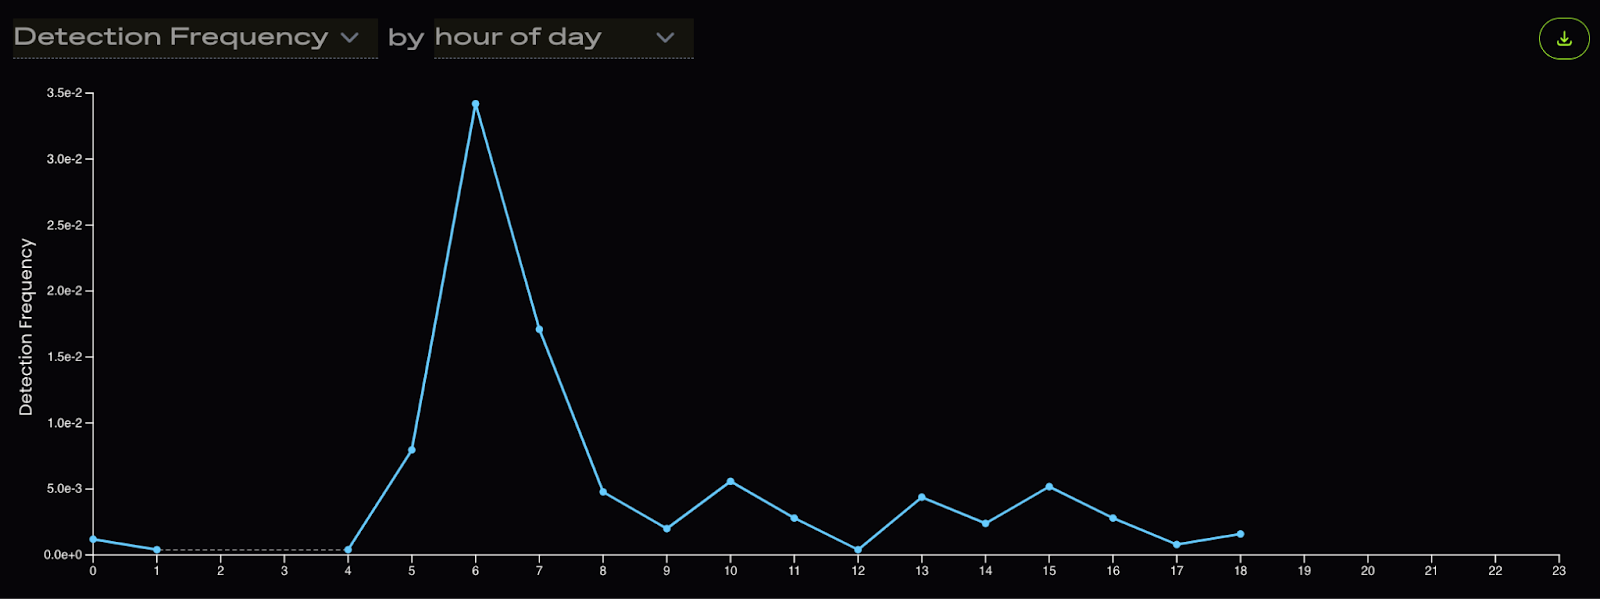
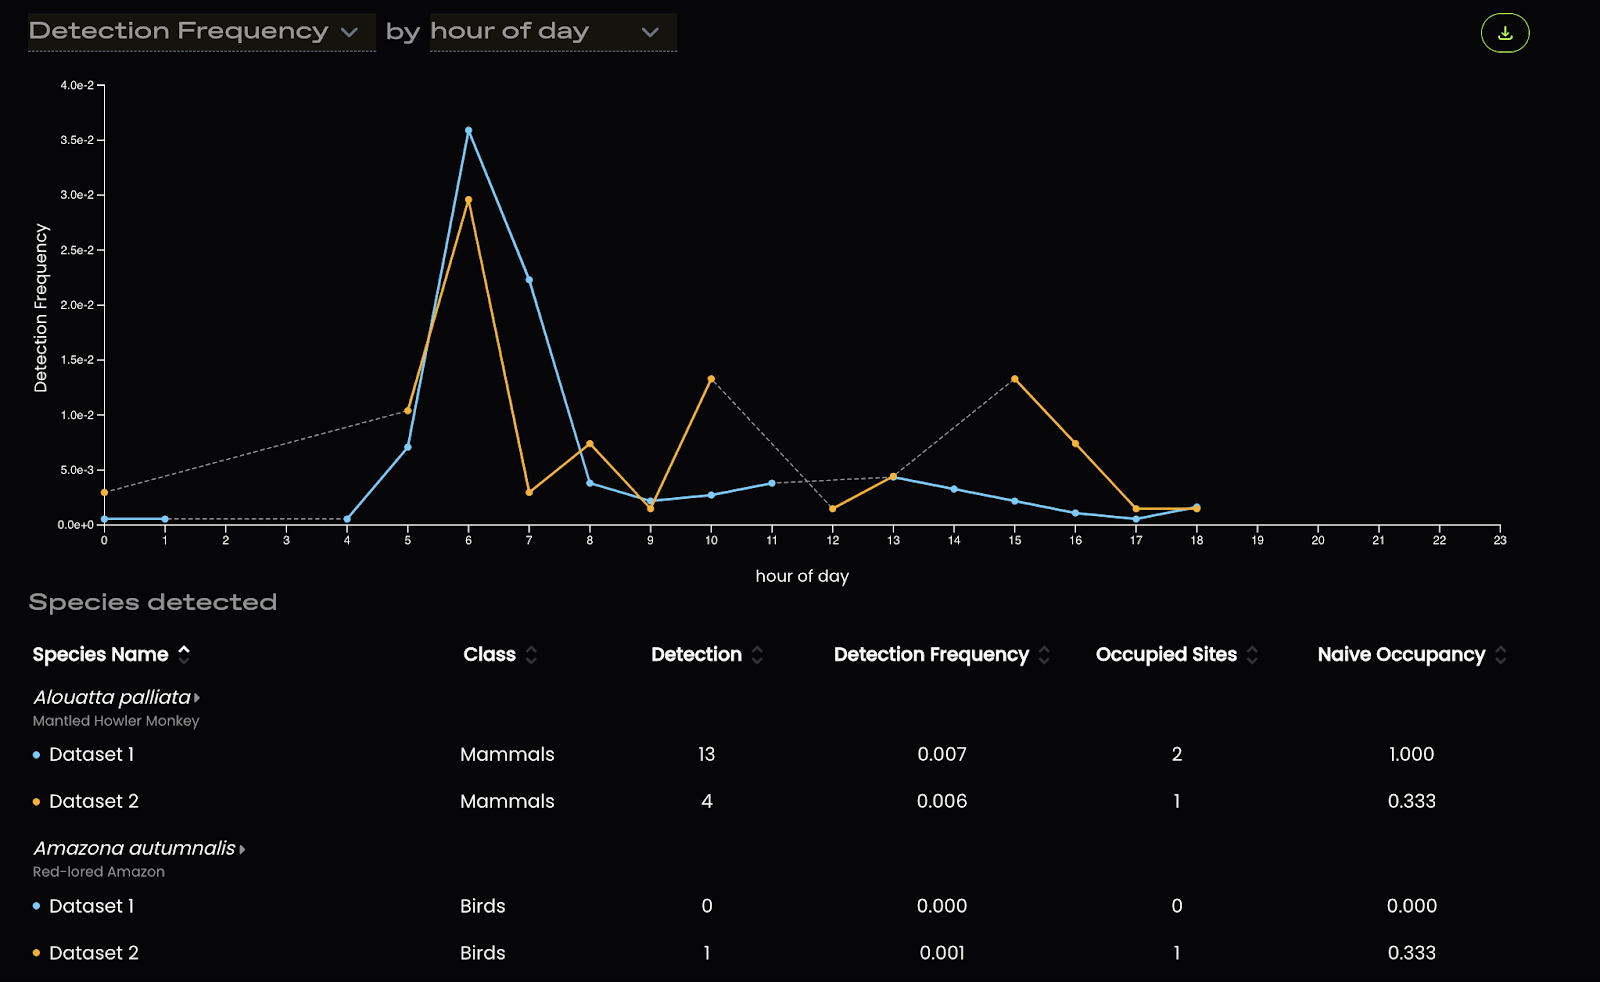
Next, there is a graph displaying the detection frequency or number of detections over different time frames (time of day, month of the year, etc.).
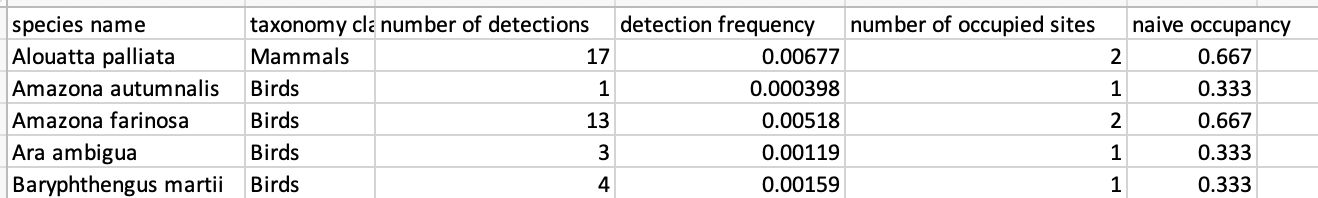
Finally, there is a table showing all the detected species and each of their total number of detections (detection), detection frequency, number of sites detected at (occupied sites) and naive occupancy (number of sites detected at / total number of sites).

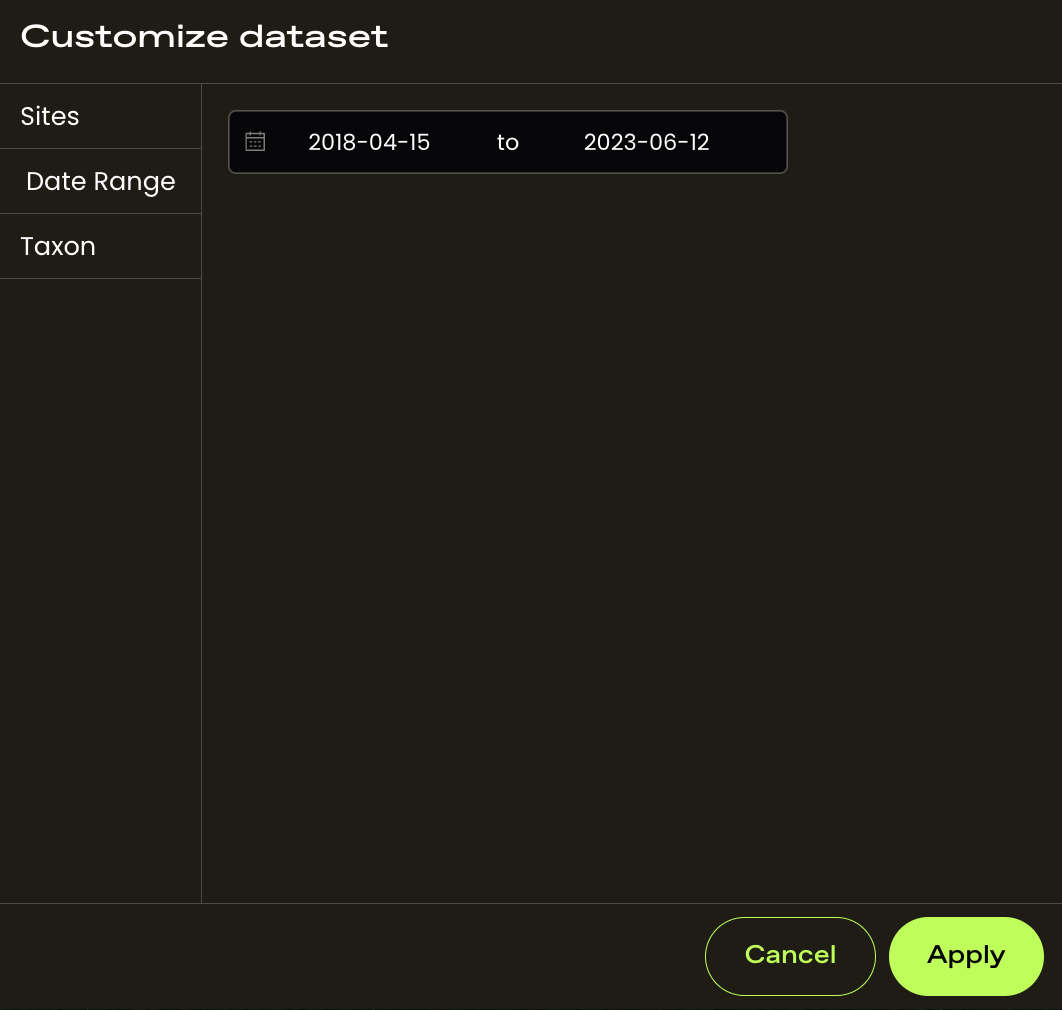
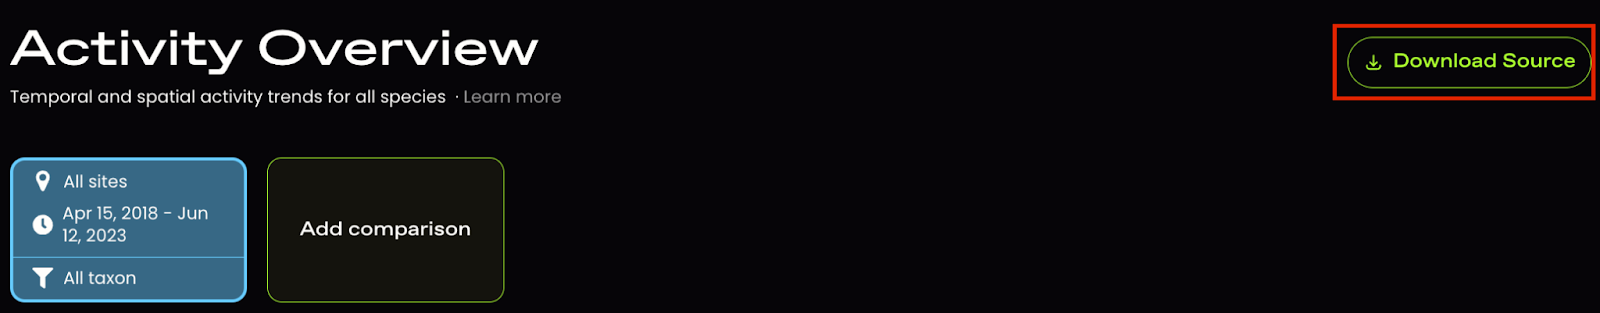
Like the other Insights pages, you can create side-by-side comparisons by subsetting the data by site, date range, or taxa.
The comparisons will then show up like this:
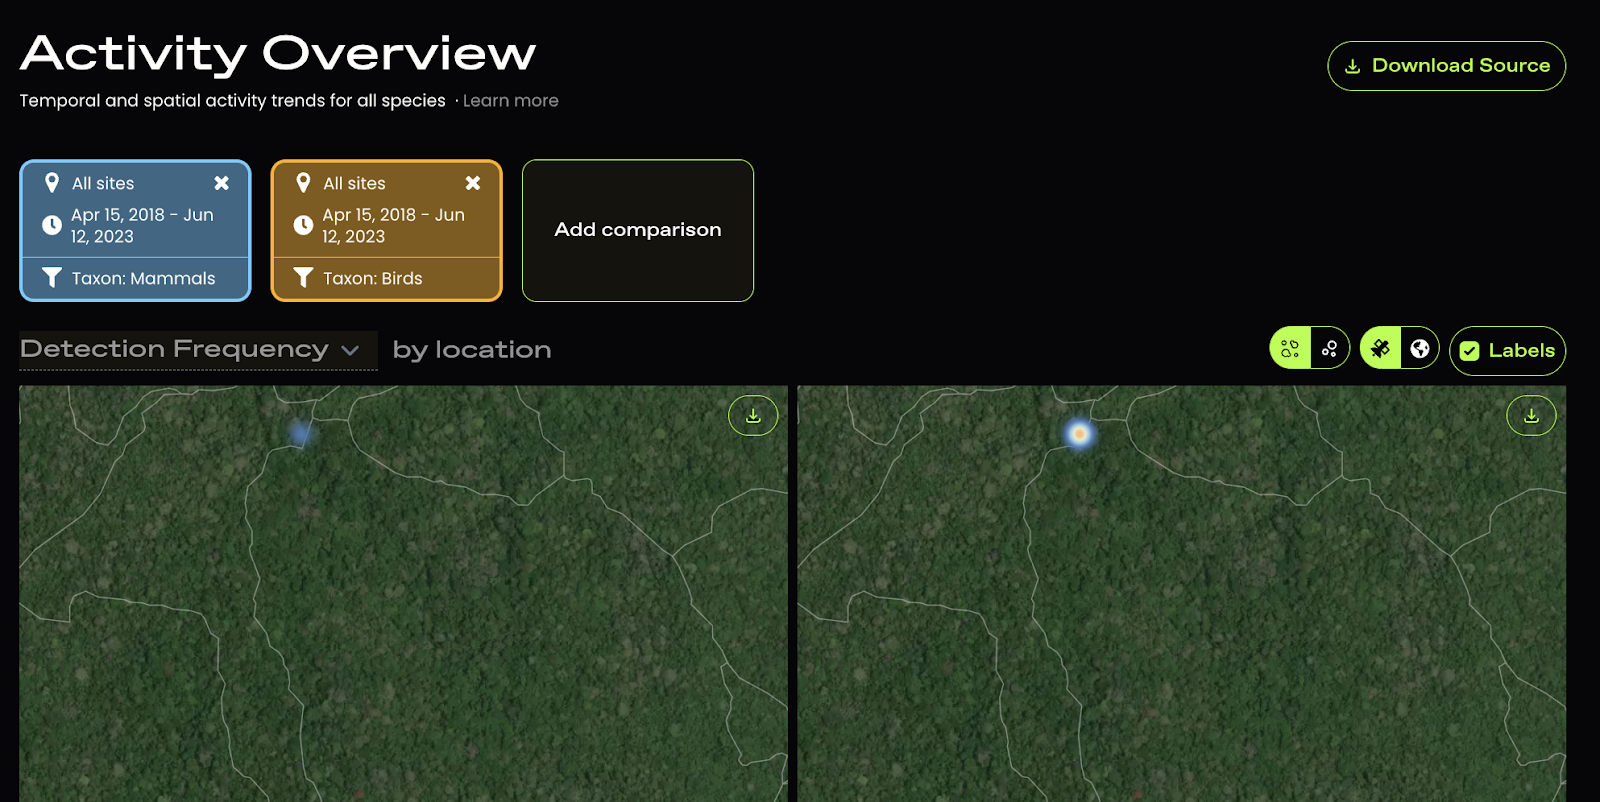
You can download the data that is used to create these figures as a spreadsheet by clicking the Download Source button on the top-right of this Spotlight page.
This will download a file that looks like this: