
Ecoacoustics Glossary
Note: If a term has a [**] next to it, we are giving a definition that is specific to the term’s use in Arbimon.
Amplitude: The relative strength of a sound wave, with higher amplitude sounds perceived as louder. Amplitude is determined by the amount of displacement of air particles in a sound wave.
Acoustic Indices: Mathematical calculations used to measure a soundscape holistically based on its acoustic properties (i.e., statistical measures of acoustic energy). Many (60+) have been developed, most of which calculate the power ratio between different frequency and/or time bins across a raw soundscape.
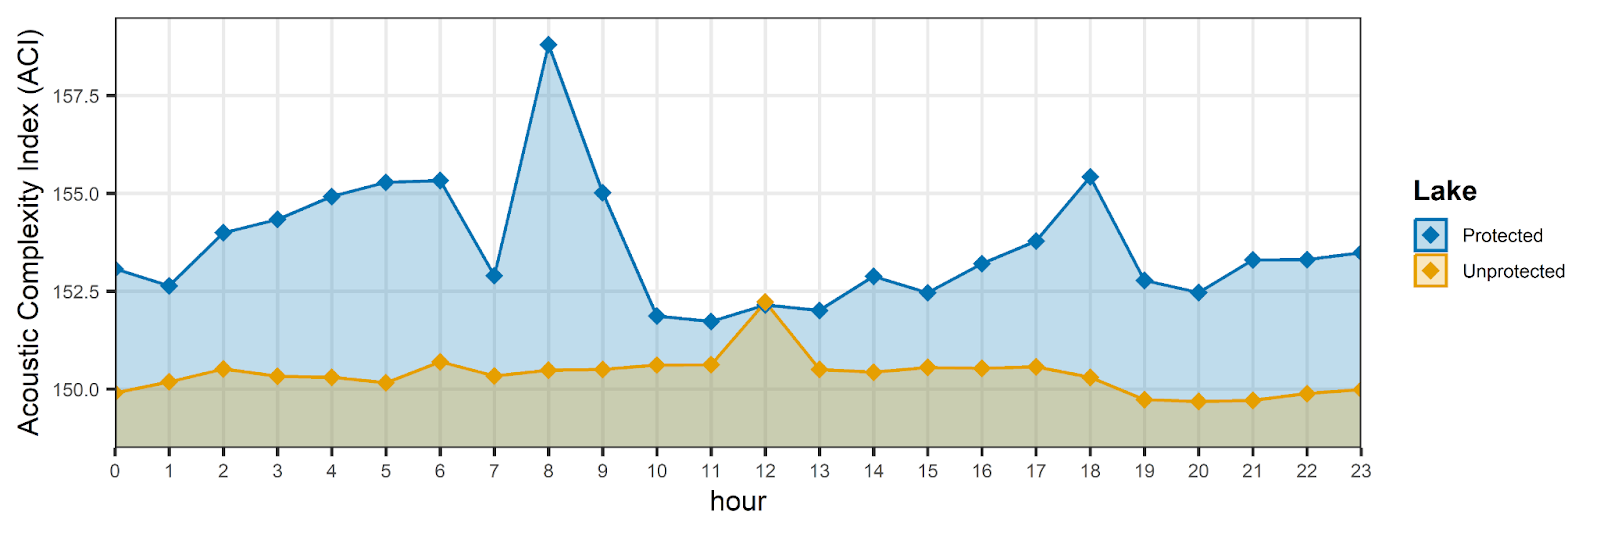
Figure: Example of an Acoustic Complexity Index (ACI) by time of day from a protected and unprotected lake in the Amazon Rainforest. Higher values mean time intervals with more diversity of sound intensities. For more information, see Do Nascimento et al 2020.
**Acoustic Space Use (ASU): An acoustic index that measures the amount of the frequency range and time being used in a soundscape. Some studies have shown this index to be positively related to species richness such that sites with higher ASU values have more species. By analyzing the frequencies most used in a sonogram, it is possible to identify which taxonomic groups are contributing to the ASU (e.g. birds, frogs, insects).
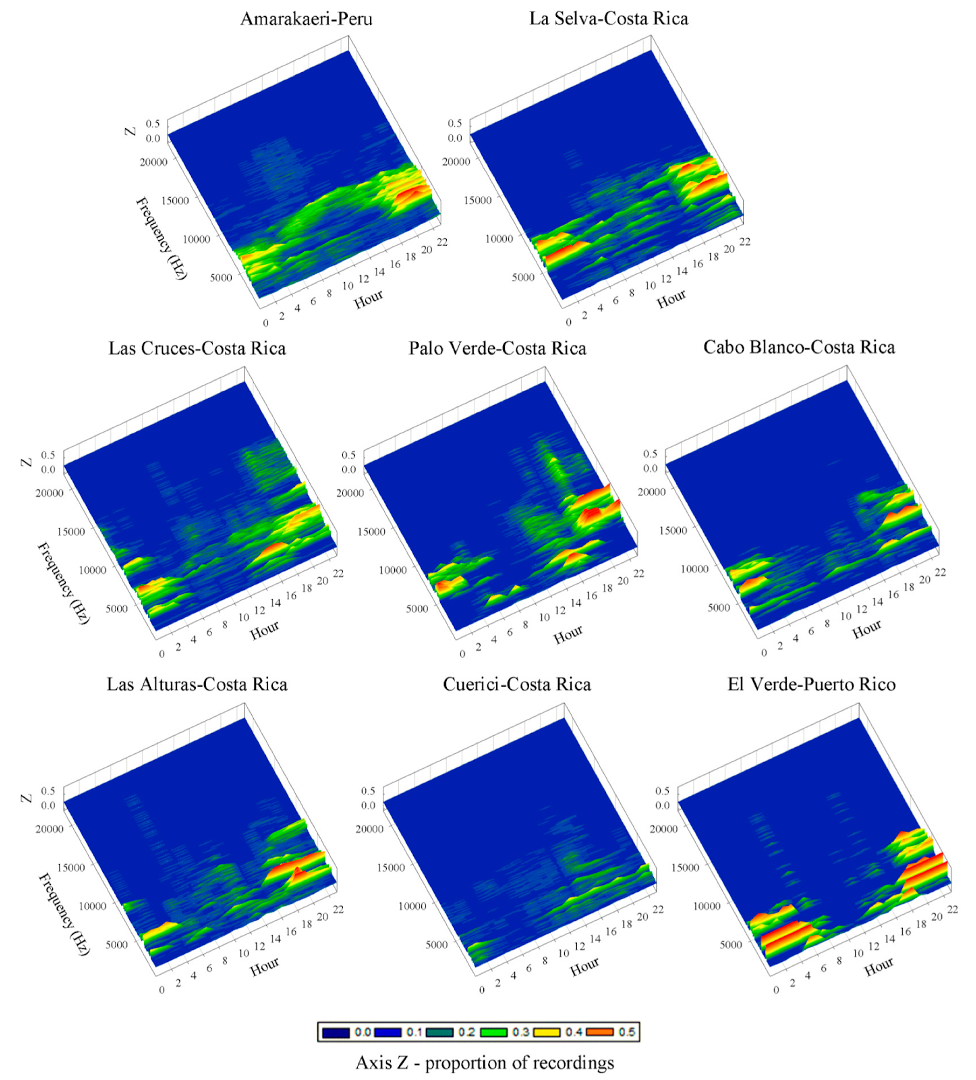
Figure: 3D plot showing ASU from different sites. The axes represent hour (x), frequency (y) and the proportion of observations (z). From: Aide et al. 2017.
Anthropophony: All sound produced by human activity in a soundscape (e.g., human voice, construction, vehicles).
Attenuation: The gradual reduction in the strength of a sound signal as it travels through a medium (air, water, etc.). Specifically, the loss of energy in the sound wave.
Audible sound: The frequency range a human can hear: 0.2kHz - 20kHz.
AudioMoth: An autonomous recording unit designed for passive acoustic monitoring. A small, low-cost, user-friendly device developed by Open Acoustic Devices.
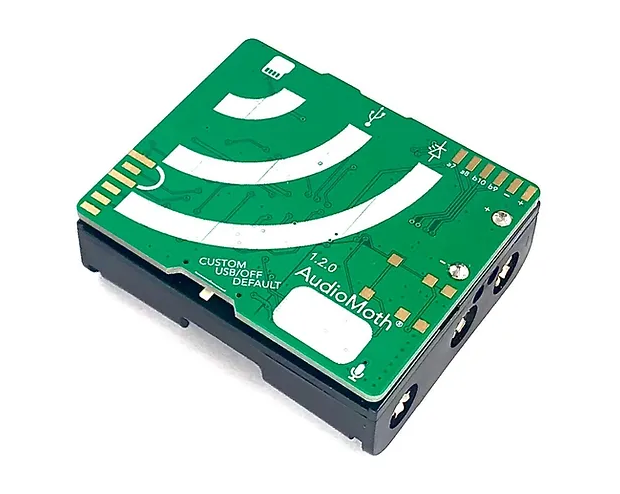
Figure: AudioMoth device
**Audio Event Detection (AED): An analysis used to automatically detect sound events satisfying user-defined parameters such as minimum amplitude, event duration and frequency bandwidth. A region of interest (ROI) is generated around each acoustic event. These ROIs can then be inspected in the Arbimon Visualizer tool or analyzed with the Arbimon Clustering tool.
Bandwidth: The range of frequencies contained in a sound. It is the difference between the highest and lowest frequencies in a sound and typically measured in Hertz (Hz).
Bioacoustics: The study of sound production, reception and communication in living organisms, particularly animals.
Biophony: All sounds produced by animals in a soundscape.
Classification: The process of classifying species-specific sounds. There are currently a wide range of algorithms used to identify species classification automatically.
Clipping: A distortion in a sound recording caused when the amplitude is greater than the capacity of the recording system.
**Clustering: In the context of ecoacoustics, an analytical method used to automatically partition a dataset of audio events into distinct sound types, such that sounds with similar acoustic features are clustered together.
Convolutional Neural Network (CNN): A type of deep learning model designed for image recognition. CNNs have demonstrated strong performance in the field of sound recognition, where they are typically applied to spectrogram images. They can be trained to detect many sound classes, provided there is an adequate labeled dataset of input audio and target output labels (for more details see LeBien et al. 2020).
Detectability: The probability of encountering a species in a survey. Detectability can be influenced by several factors, such as sampling effort, sampling method, type of environment, and the researcher's experience.
Detections: The number of times a species has been detected over a spatial (e.g., site) or temporal (e.g., date) scale.
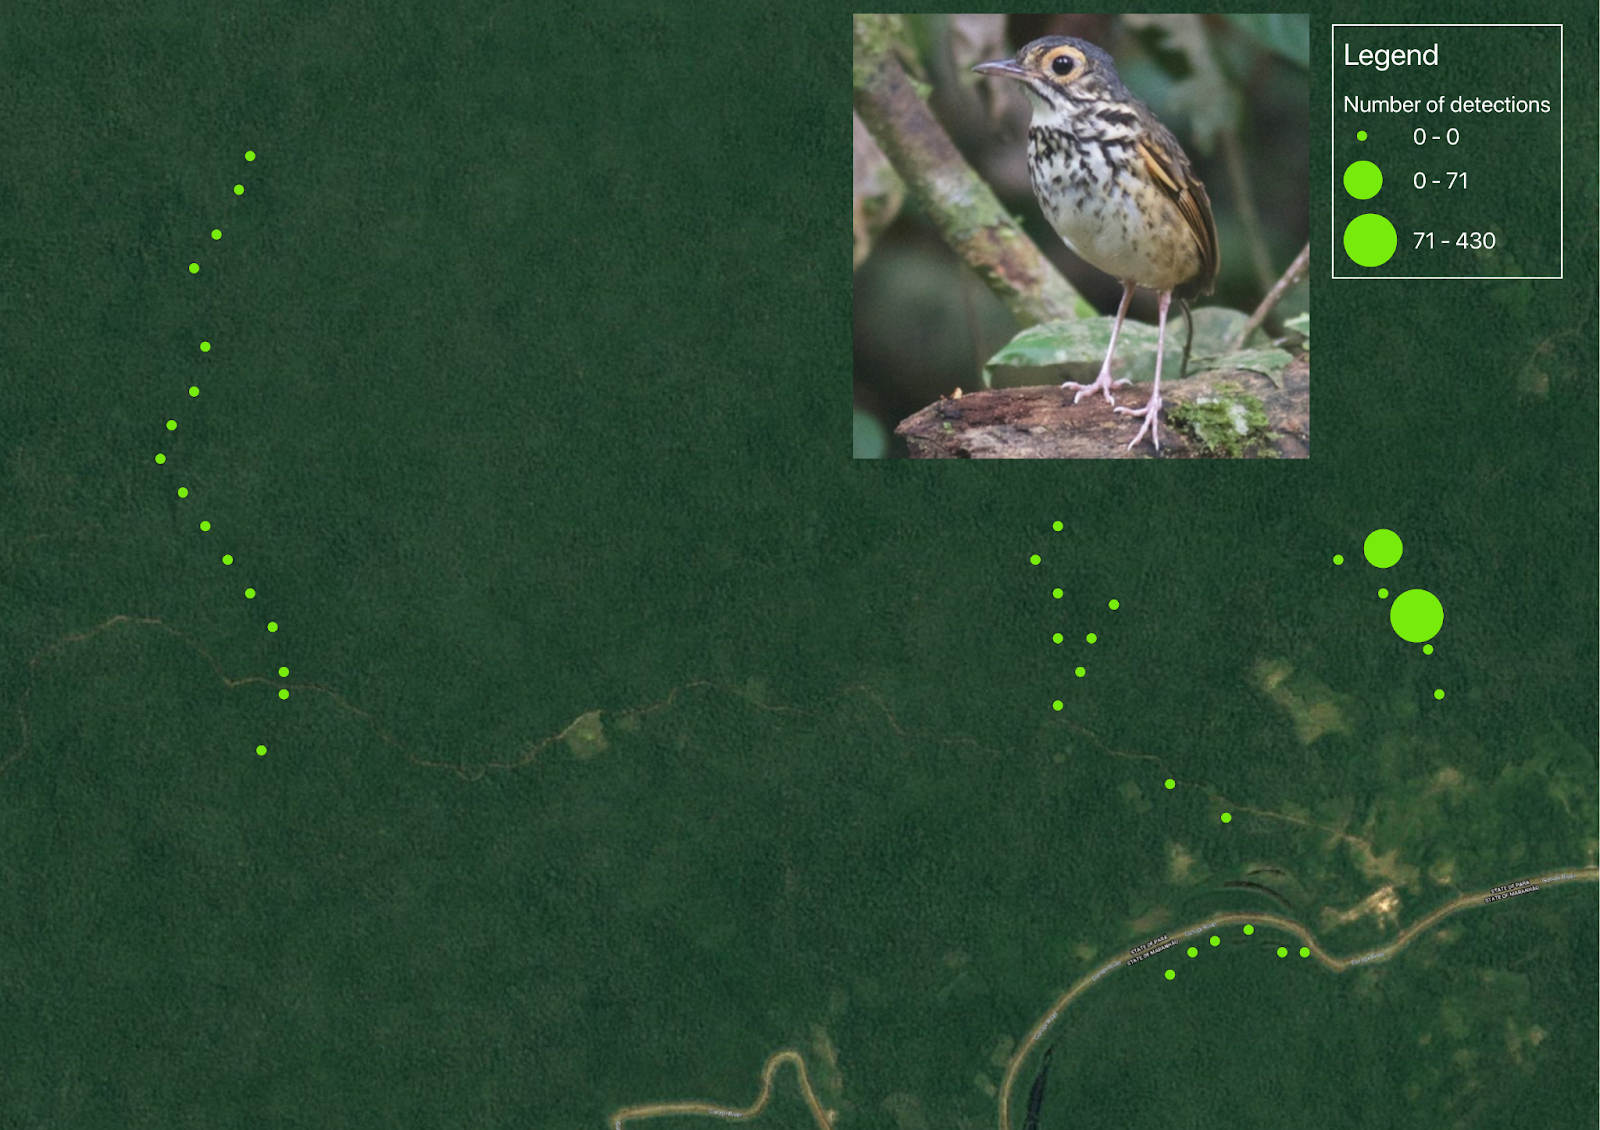
Figure: Map showing the number of detections of a bird on different sites (each point corresponds to a site). This is a rare species detected in only two sites in this study area.
Detection range (of a recorder): The distance at which a recorder can reliably detect a target sound. The detection range may vary between species, environments, and recording equipment.
Detection frequency: The number of recordings/hours with a species-specific detection, divided by total number of recordings/hours.
Ecoacoustics: An interdisciplinary field that focuses on the relationship between bioacoustics and ecology. It combines methods and techniques from acoustics, ecology, environmental science and conservation biology to investigate how acoustic signals produced by living organisms interact with the physical and biological environment.
False negative: The failure to detect a species when it is actually present in the area; statistically a type II error in hypothesis testing.
False positive: The detection of a species when it is not present; statistically a type I error in hypothesis testing.
Fast Fourier Transform (FFT): A widely-used algorithm for efficiently calculating the amplitudes of frequencies in a signal. Used to create spectrogram images by transforming raw sound data from the time-amplitude domain to time-frequency domain.
Frequency: The number of cycles per unit time, measured in hertz (Hz, cycles per second) or kilohertz (kHz, thousands of cycles per second). Perceived as pitch.
Gain: The amount of amplification applied to an audio signal.
Geophony: All the sounds produced by geophysical events (e.g., wind, a waterfall, etc.).
Guardians (RFCx): Automated recording units developed by RFCx to detect threats (e.g., deforestation, poaching) and monitor biodiversity. An online device that streams audio data to the cloud, providing real-time monitoring directly from the forest canopy. Guardians consist of a custom board, weatherproof box, antenna, microphone, and solar panels to charge the battery. To learn more about the Guardian and its applications, contact us!

Figure: RFCx Guardian Device
Harmonics: A series of frequencies that are integer multiples of a fundamental frequency produced by a vibrating object, such as the vocal cords of a human or an animal.
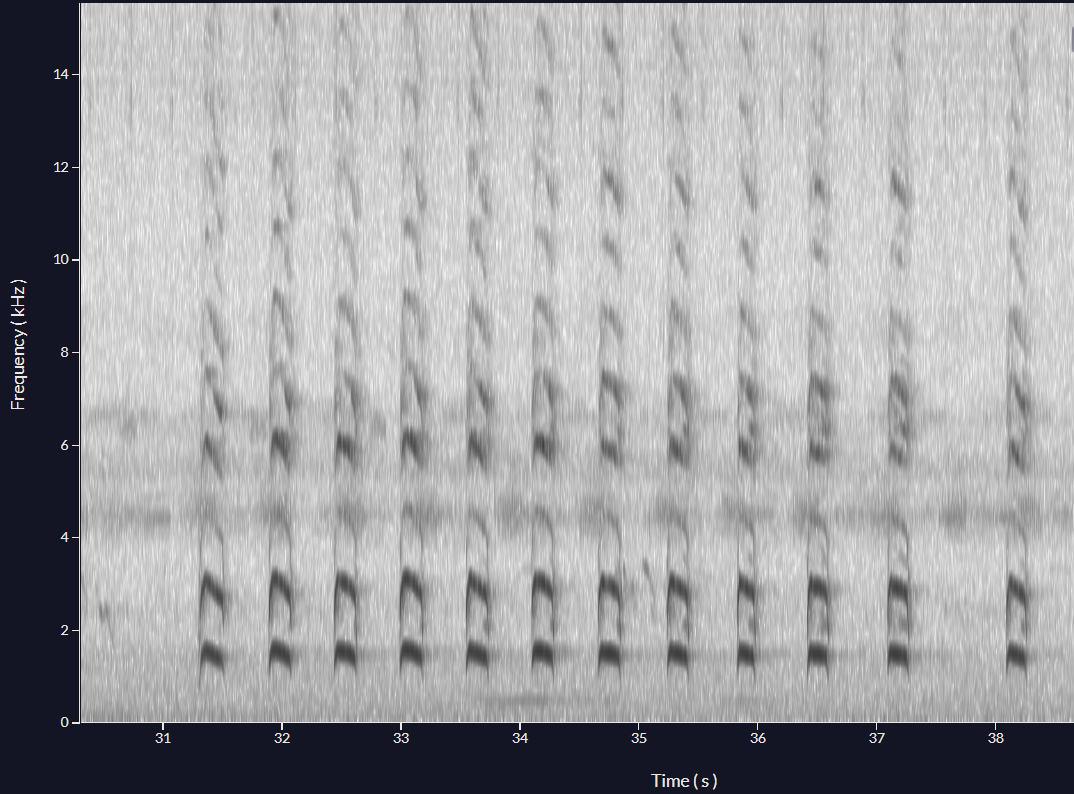
Figure: Song of the Green-barred Woodpecker (Colaptes melanochloros)
Infrasound: Sound waves with a frequency below the threshold of human hearing (<20Hz).
Machine learning (ML): A subfield of computer science focused on developing algorithms that can be tuned (“trained”) to automate tasks using data. ML algorithms learn to predict or assign different class labels based on a user-annotated training dataset. For ecoacoustics, training data may consist of a set of species-labeled sound clips, which the model uses to detect and classify species-specific calls in test data (i.e., the objective function to optimize would be the difference between the predicted labels and actual labels.)
- Supervised machine learning: In this case, models are trained to identify specific patterns of interest using data that has corresponding target outputs (i.e., labels/classes). For example, models trained to detect certain species in soundscapes are supervised models.
- Unsupervised machine learning: In this case, the algorithm learns patterns without being given explicit target outputs (i.e., labels/classes). In other words, the algorithm is not told what the correct output is, but instead discovers patterns and structures on its own. Unsupervised learning is often used for tasks such as clustering, where the algorithm groups similar data points together based on their shared characteristics.
Microphone sensitivity: The minimal amplitude required at a given frequency for a microphone to detect a sound.
Microphone directionality: The degree to which a microphone is preferentially sensitive to sound arriving from certain directions.
Metadata: Data that describes other data. Used to provide information about the content, structure, and context of data, such as a recorder’s configuration settings, location recorder was deployed, file format, and field notes. Metadata is used to help organize, manage, and make sense of large amounts of data.
Non-Metric Multidimensional Scaling (NMDS): A multivariate analysis technique used to visualize and explore similarities or dissimilarities between samples. NMDS is a type of ordination method that reduces the dimensionality of the data by creating a new set of variables, called axes or dimensions, which captures the most important patterns in the data. For more details on using this with soundscapes, see Furumo & Aide 2019.
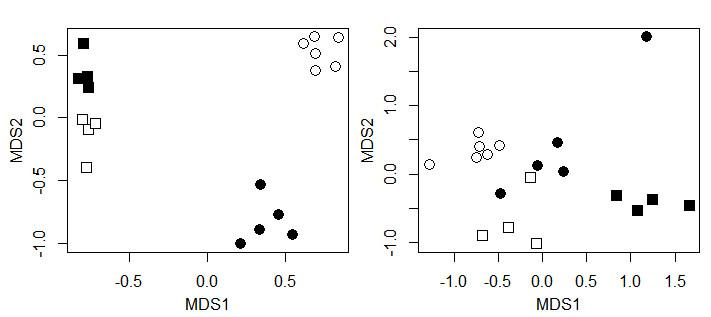
Figure: Example of NMDS ordinations representing dissimilarity in species composition in four different locations (represented by differently colored squares and circles). Each point in the ordination is a site. In the left panel, the points are well-separated between the locations, suggesting species composition in each location is different. In the right panel, points from different locations are closer together, suggesting species composition is similar.
Noise: Everything except the sound(s) of interest (e.g., wind, machines, etc.)
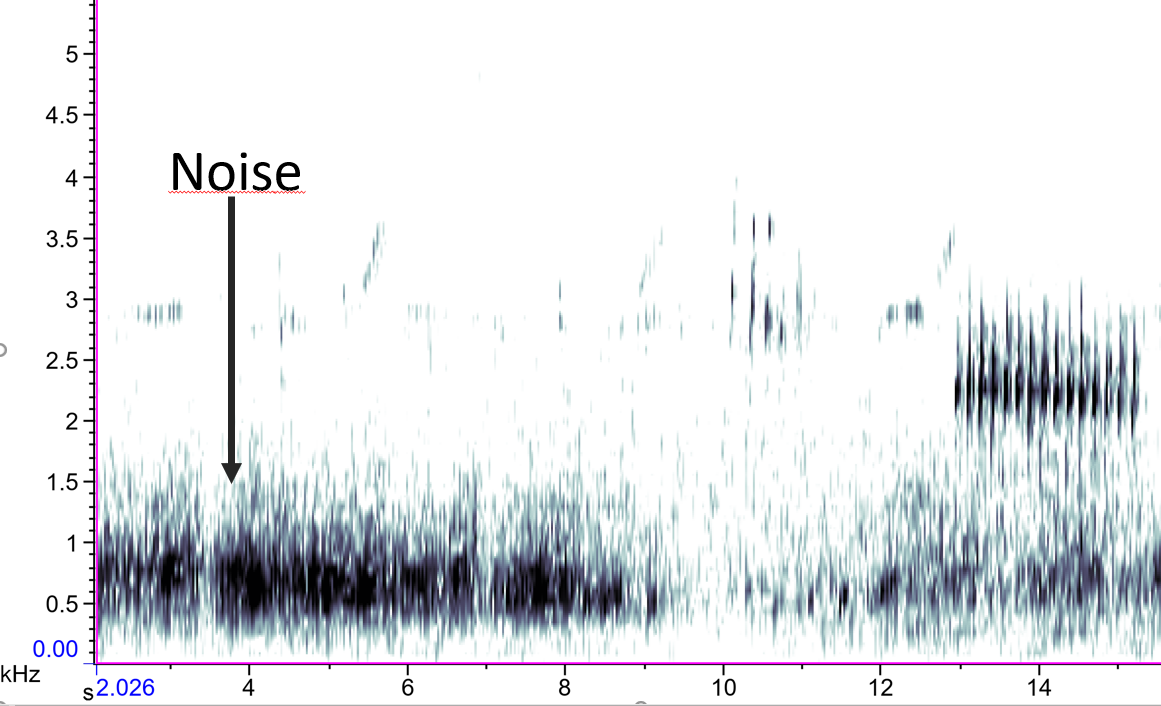
Figure: Example of a low frequency anthropogenic noise.
Nyquist frequency: Half the sampling rate (see sampling rate below). Corresponds to the highest frequency that can be accurately represented or sampled. For example, if a recorder is configured to record at a sampling rate of 48kHz, the Nyquist frequency is 24kHz.
Occupancy: Defined as the proportion of sites, patches, landscapes or habitat units occupied by a taxon. See MacKenzie et al. 2006 and Bailey et al. 2014 for more information.
- Naïve occupancy: The proportion of sites where a target species was detected.
- Occupancy analysis: A type of statistical analysis that uses species detection and non-detection data to estimate the probability that a site is occupied by a species. Occupancy models estimate the true occupancy probability of a species at a site while accounting for imperfect detection. Occupancy models can incorporate environmental and climatic characteristics of a site. See Campos‐Cerqueira & Aide 2016 for an example of how occupancy models can be used to analyze data from acoustic monitoring.
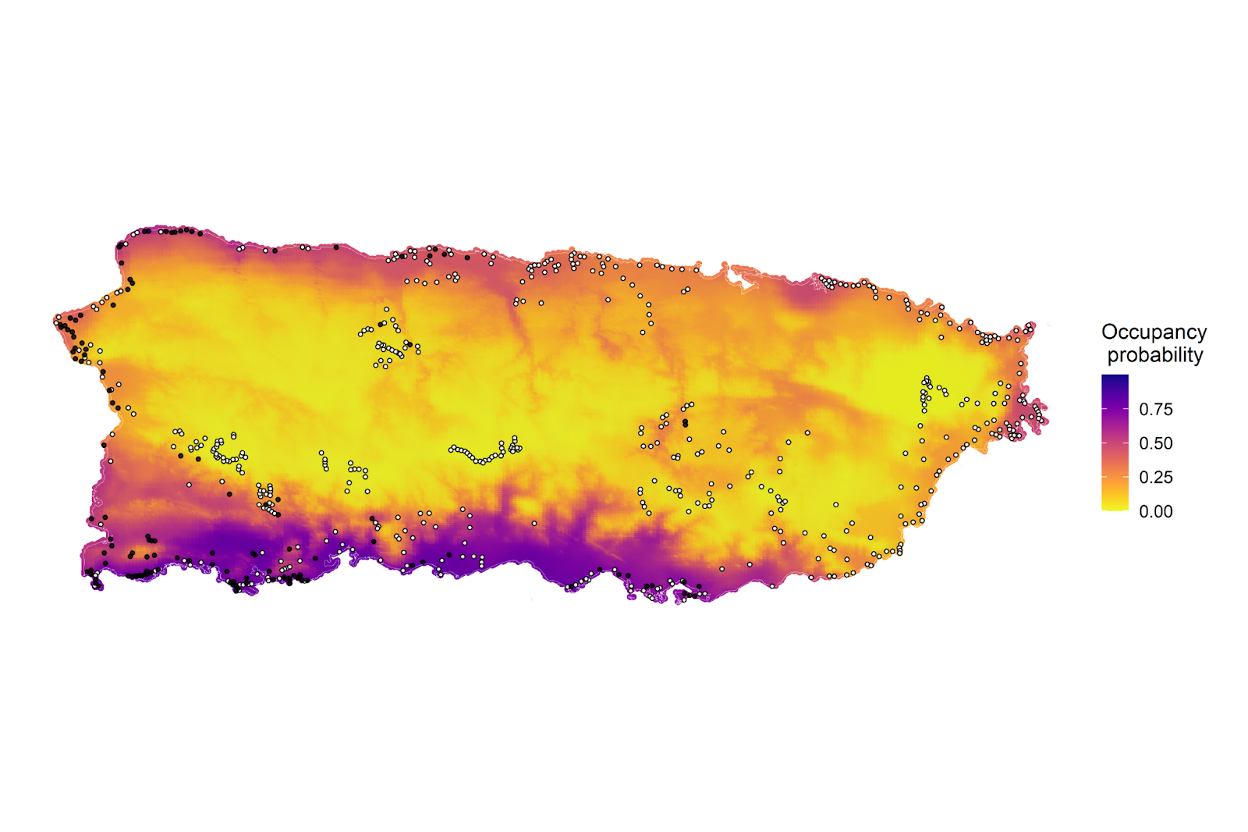
Figure: Map representing the mean occupancy probability of the Venezuelan troupial (Icterus icterus) in Puerto Rico. From Ribeiro et al. 2022.
Passive acoustic monitoring: A conservation technology method to survey and monitor wildlife and ecosystems using autonomous acoustic recorders deployed in the field. The recordings are then analyzed to extract valuable ecological data, such as detecting species-specific calls.
**Pattern Matching (PM): Also referred to as template matching. An automated sound detection algorithm that uses a single example of a target signal (i.e., the template) to search a larger set of recordings for similar signals based on a user-defined correlation (i.e., similarity) score. In Arbimon, this is done via cross-correlation. To learn more about how to run Pattern Matching in Arbimon, read our support documentation and scientific publication.
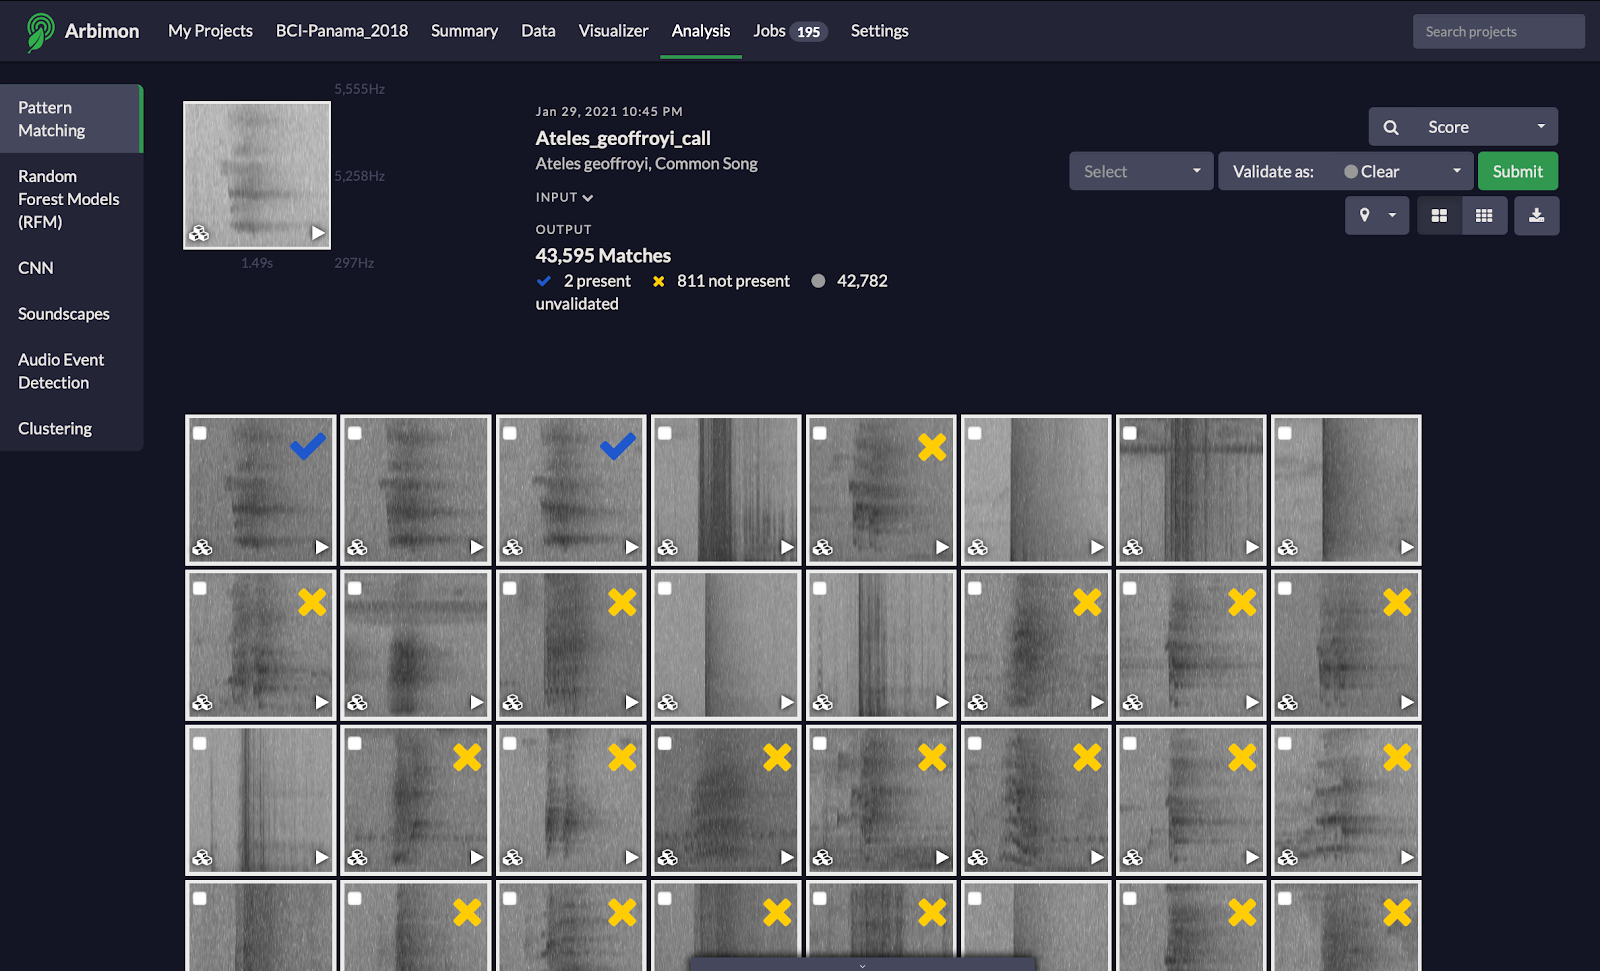
Figure: Example of pattern matching on RFCx-Arbimon platform.
**Playlist: A set of recordings grouped according to user-defined criteria and filters (e.g., by site, presence of a particular species, etc.). In Arbimon, playlists are an essential component for all analyses since it is necessary to select which set of recordings the analysis will be run over.
Recordings: Sound files obtained by an autonomous recorder.
**Random Forest Model (RFM): A type of machine learning model consisting of an ensemble of decision trees. In Arbimon, the RFM module is designed for single-species detection. Find more information about Arbimon’s RFM in this publication.
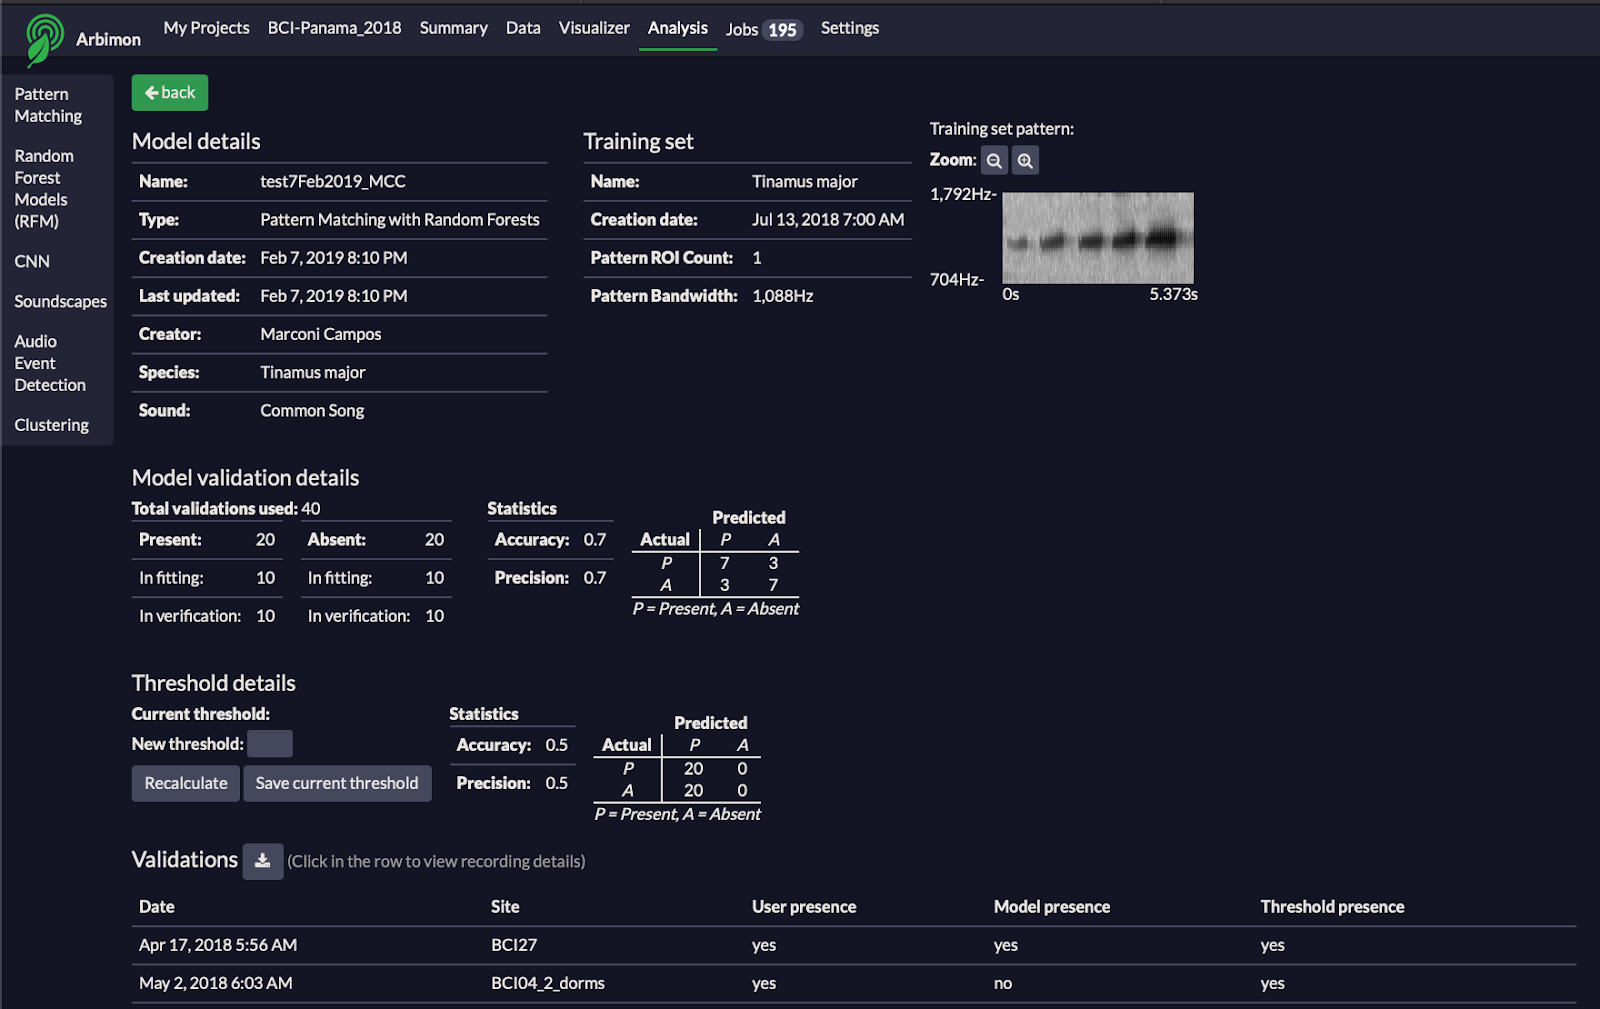
Figure: Example of Random Forest Model on RFCx-Arbimon platform.
**Region of Interest (ROI): A bounding box delimiting a specific section in a spectrogram, denoting start time, end time, minimum frequency, and maximum frequency. In Arbimon's Pattern Matching analysis, the template chosen by the user is shown as an ROI, as well as each detection.
Sample rate: How many times per second that samples will be collected by the recording device. For example, if we configured a recorder with a sampling rate of 44.1kHz, it means that it was collecting 44,100 samples per second.
Sampling sites: The locations where data is collected. For example, a location where a recorder is installed is a sampling site.
Signal-to-Noise ratio (SNR): A measure of the ratio between the strength of a signal and the strength of background noise present (i.e., how much stronger the signal is than unwanted background noise).
Species composition: The set of taxa present in a given community with or without their relative abundances. It is used to describe and compare different biological communities and can provide a useful understanding of how environmental factors affect the distribution and diversity of taxa.

Figure: Two sites with the same species richness (3), but different species compositions.
Species richness: The number of different taxa present in a given area. It is a simple but important metric for understanding the diversity and complexity of an ecosystem.
Survey design (or Sampling design): A detailed description of the entire methodology used for sampling. This typically includes information about how sampling sites were chosen, the number of recorders used, the recording schedule, etc. The specific research questions or project goals informs the survey design.
Soundscape: All the sounds emanating from a specific location and time period. Composed of three fundamental sources: biophony (animal sounds), geophony (geophysical sounds), and anthrophony (human sounds). In Arbimon, soundscapes can be represented by a graph showing the amount of acoustic activity at each frequency within a time span.
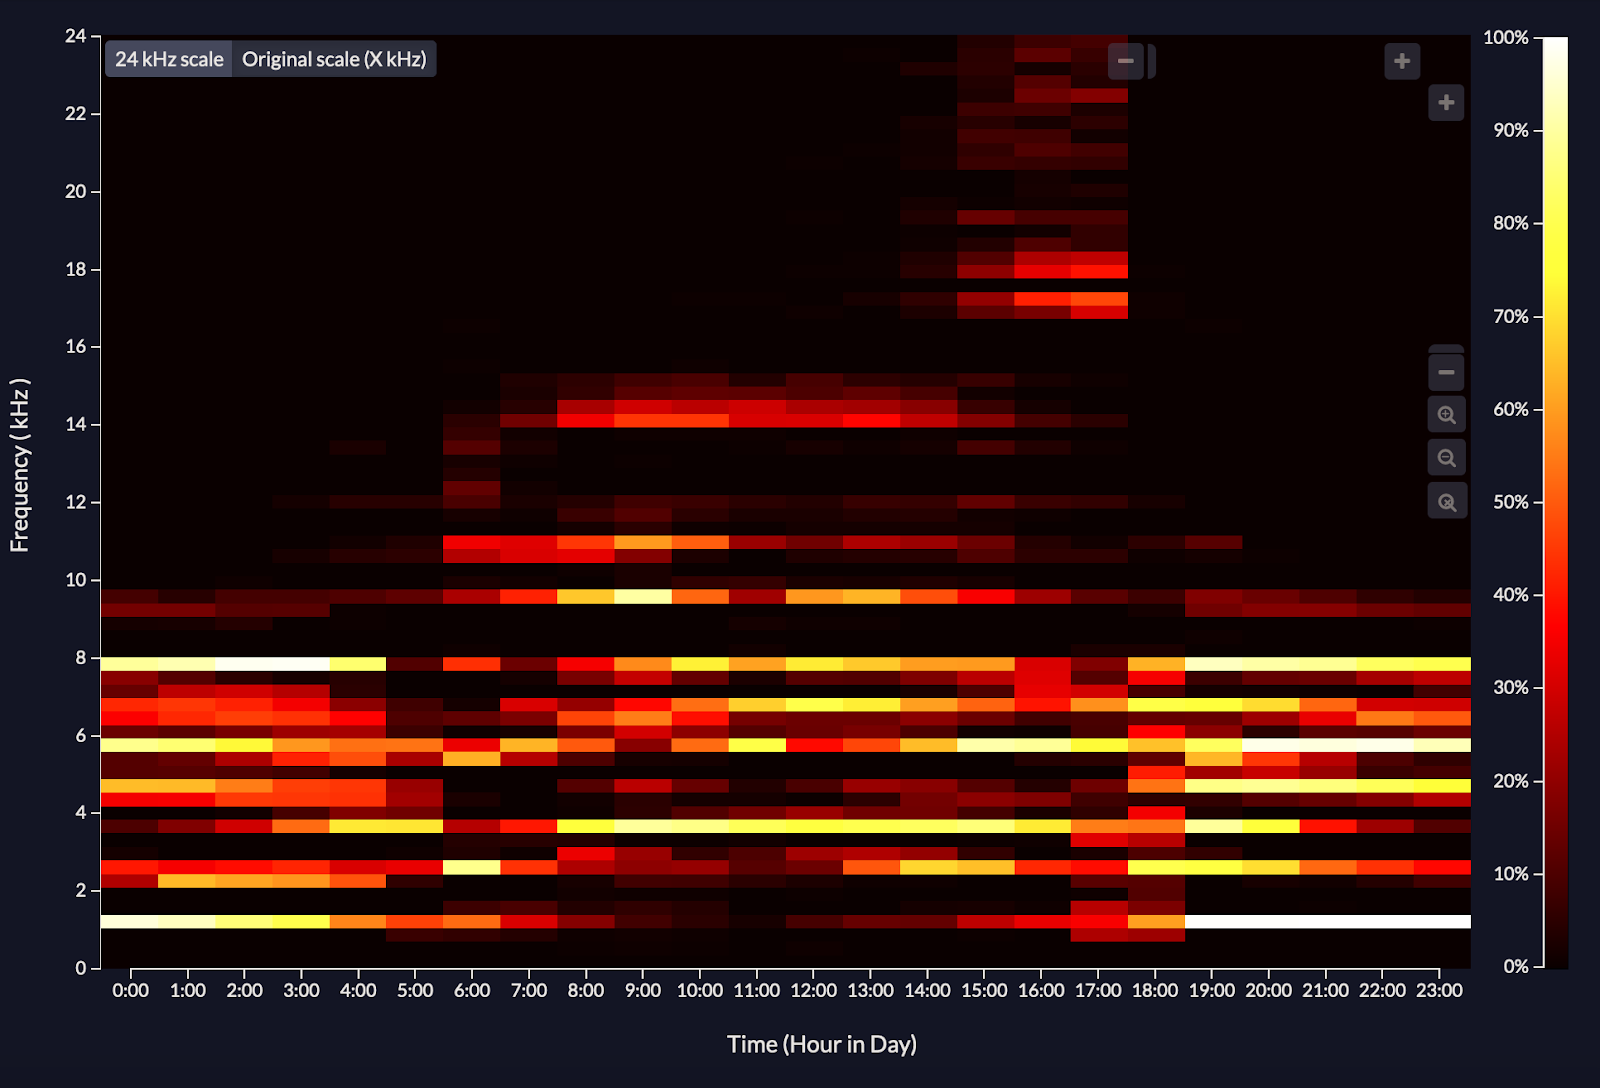
Figure: Example of a soundscape in Arbimon. Lighter colors represent areas with the greatest vocal activity within different frequency and time bins.
Spectrogram: A graphic visualization of a sound represented by frequency (pitch) on the y-axis and time on the x-axis. The color-scale in a spectrogram represents the intensity (amplitude) of a sound.
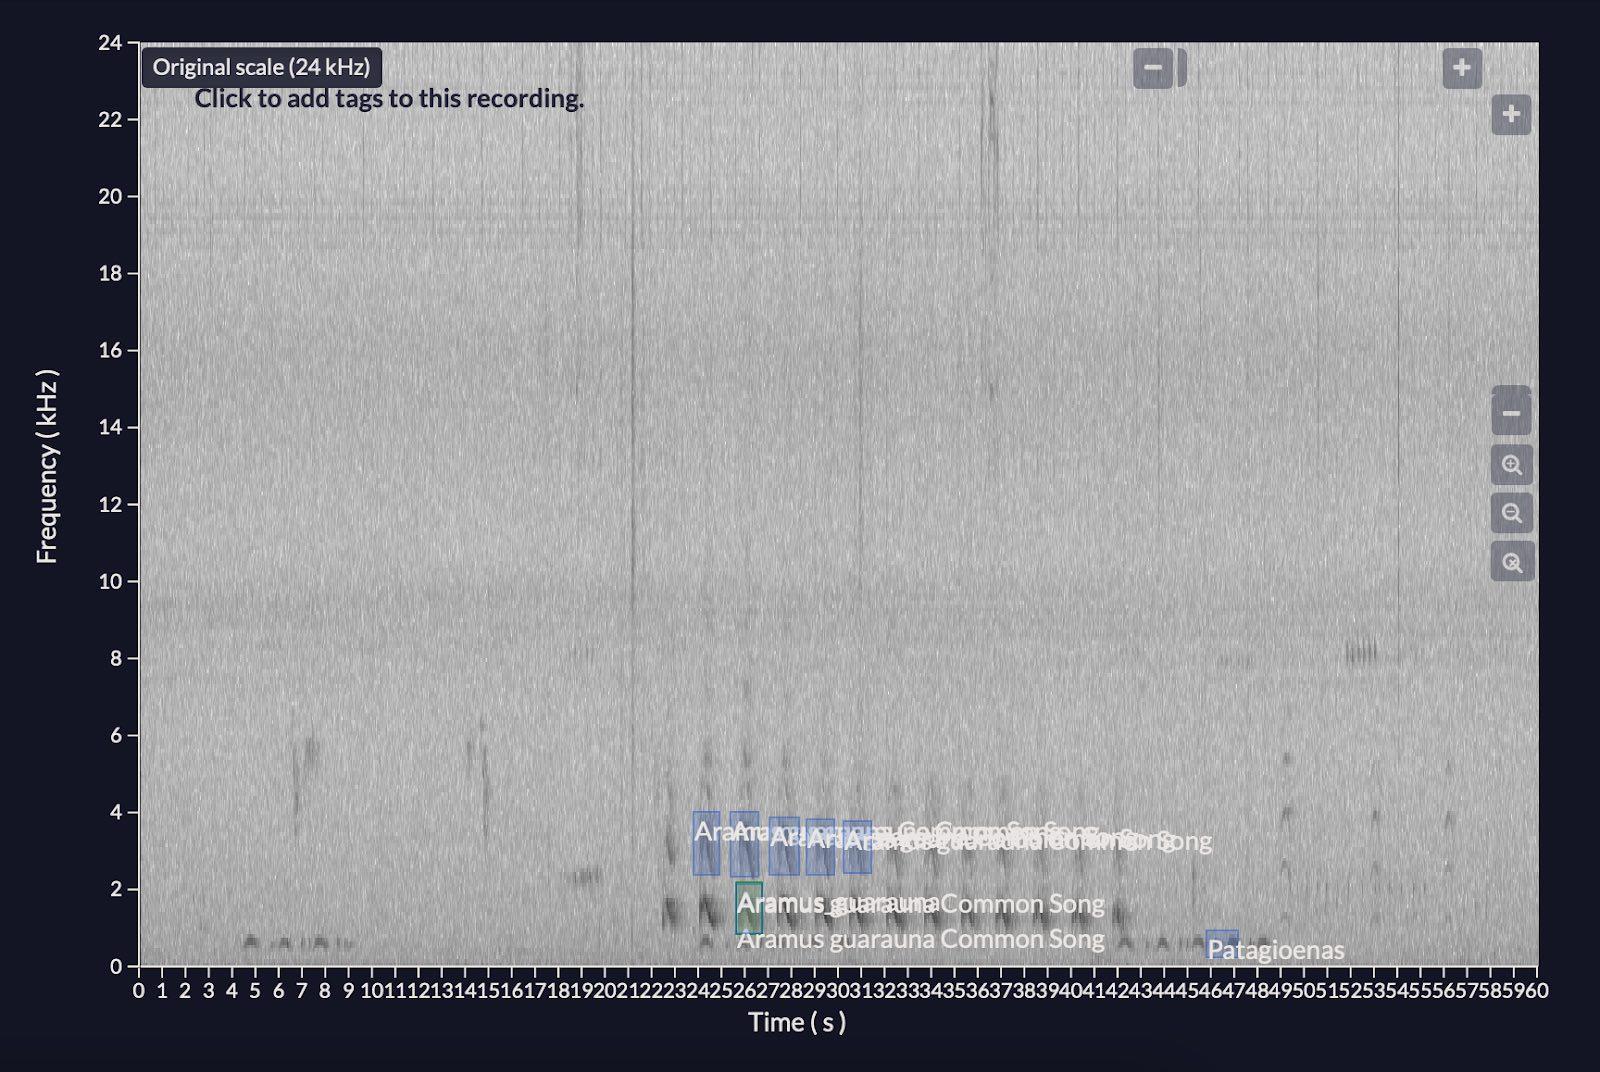
Figure: Example of a spectrogram of the Aramus guarauna call.
**Tags: Labels put in recordings to facilitate search and organization. For example, in a recording where there is doubt about the identification of a species, the user can include the tag "doubt" to be able to easily find the recording in the future. Users can put multiple tags within the same recording.

Figure: In Arbimon, it is possible to select any area of the spectrogram and include tags.
**Template: An example that best represents an acoustic signal of interest (e.g., a species-specific call). Templates can be used as input to Arbimon's acoustic analysis tools, such as Pattern Matching.
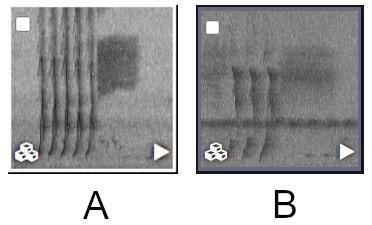
Figure: Examples of templates. (A) is a better template, with a high signal-to-noise ratio and no overlapwith other sounds. (B) is a worse template, with a lot of background noise and overlap with other sounds.
**Training sets: Used for creating Random Forest Models (RFM) and Convolutional Neural Networks (CNN). For RFM, each training set consists of one or more regions of interest (ROI’s, see above) containing the target sound and a set of recordings with validated presence of the target sound. For CNN, training sets consist of sets of ROIs from pattern matching jobs which were manually validated.
**Validation: Accurate identification and labeling of species-specific calls by an expert in the field. This can be done before or after an analysis; if the latter, the user is manually identifying the outputs of the statistical or ML tool.
Vocal activity: The amount of acoustic energy produced by a species or group of animals over a certain period of time.

Figure: Vocalizing glass frog in the Atlantic Forest, Brazil.
Ultrasound: Sound waves with frequencies above the threshold of human hearing (>20kHz).
Waveform: A graphical representation of sound with amplitude on the y-axis and time on the x-axis; each point on the graph represents the amplitude of the sound in that time period.
Wavelength: The length of time between two adjacent peaks of a sound wave.